Flowchart
A Roadmap to Process Visualization
A flowchart is a vital tool for visualizing and understanding processes and mapping out the steps involved in any procedure or system. It's essentially a visual roadmap that illustrates sequential tasks and decision points. Flowcharts, also called flow charts, are versatile and useful in diverse fields and scenarios. They employ simple symbols and arrows to document, analyze, and improve complex processes. See different flowchart types, examples, and commonly used symbols.

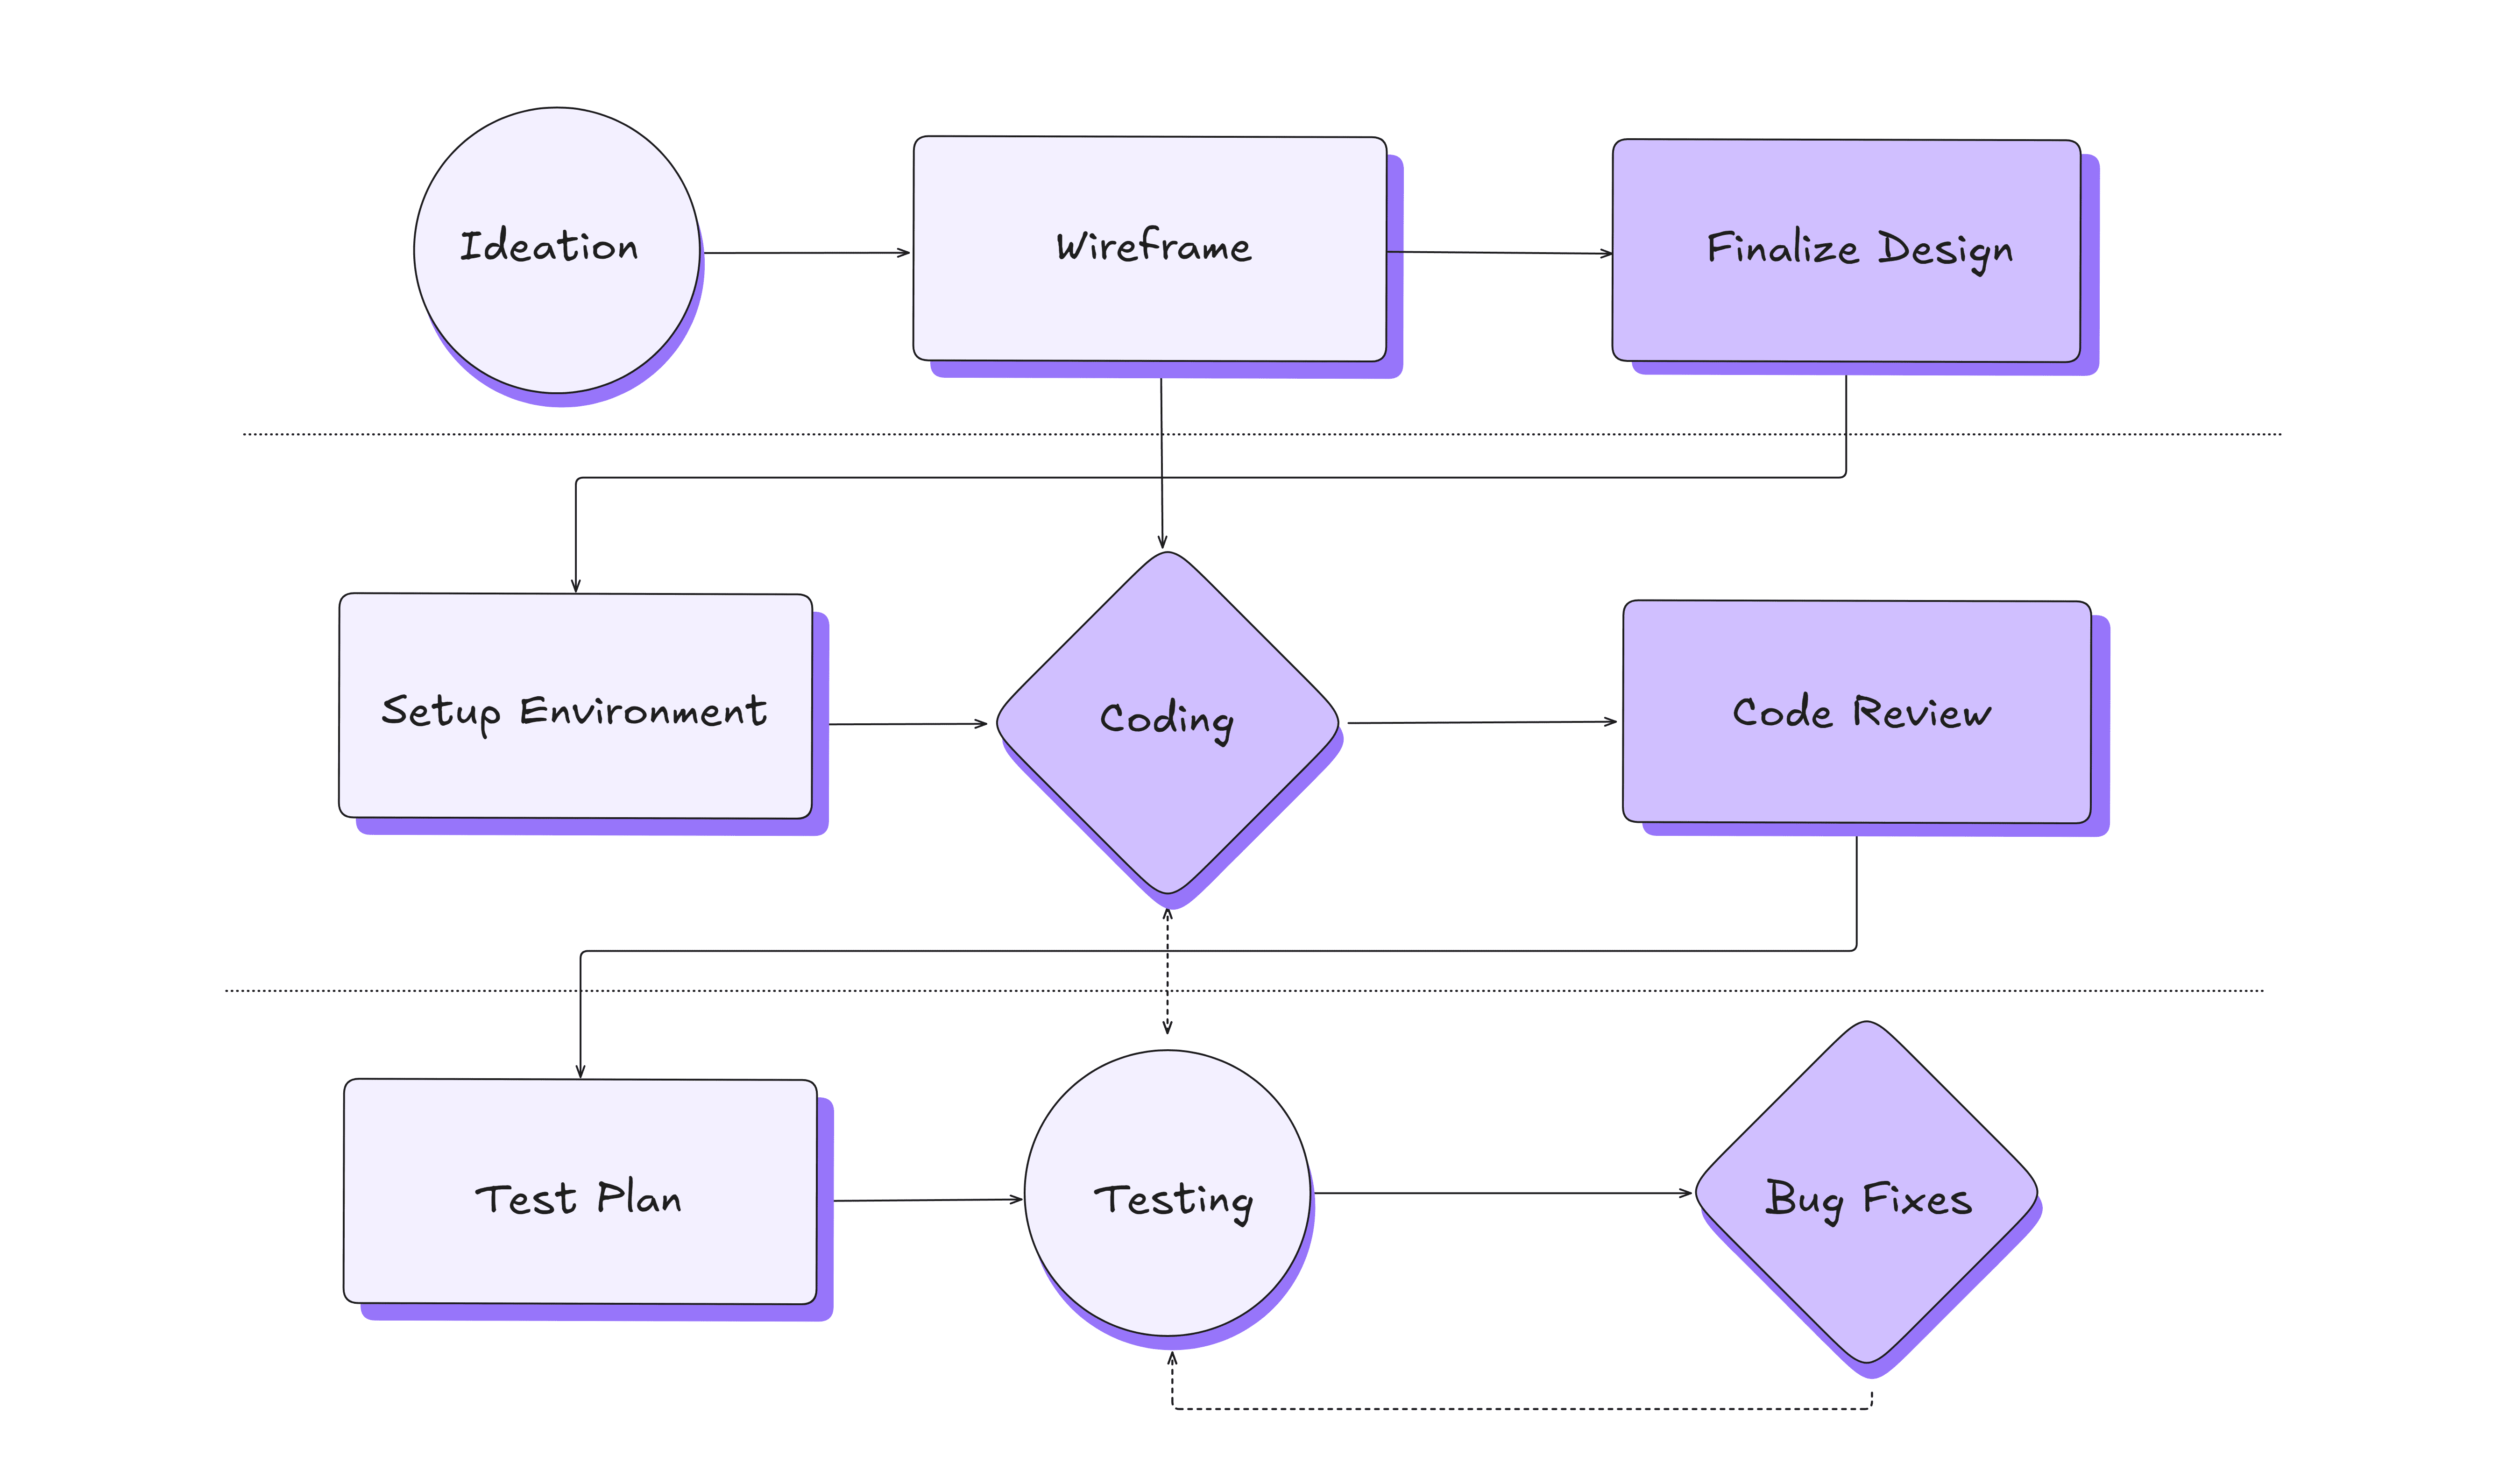
Process Flowchart
A process flowchart maps out a process step by step, showing the flow from start to finish. It’s for identifying each step in a linear format and spotting any redundancies, or delays.

Swimlane Flowchart
A swimlane flowchart organizes activities into different groups based on responsibility, whether by person, department, or system component. Ideal for processes that involve multiple stakeholders or departments, clarifying who is responsible for what.

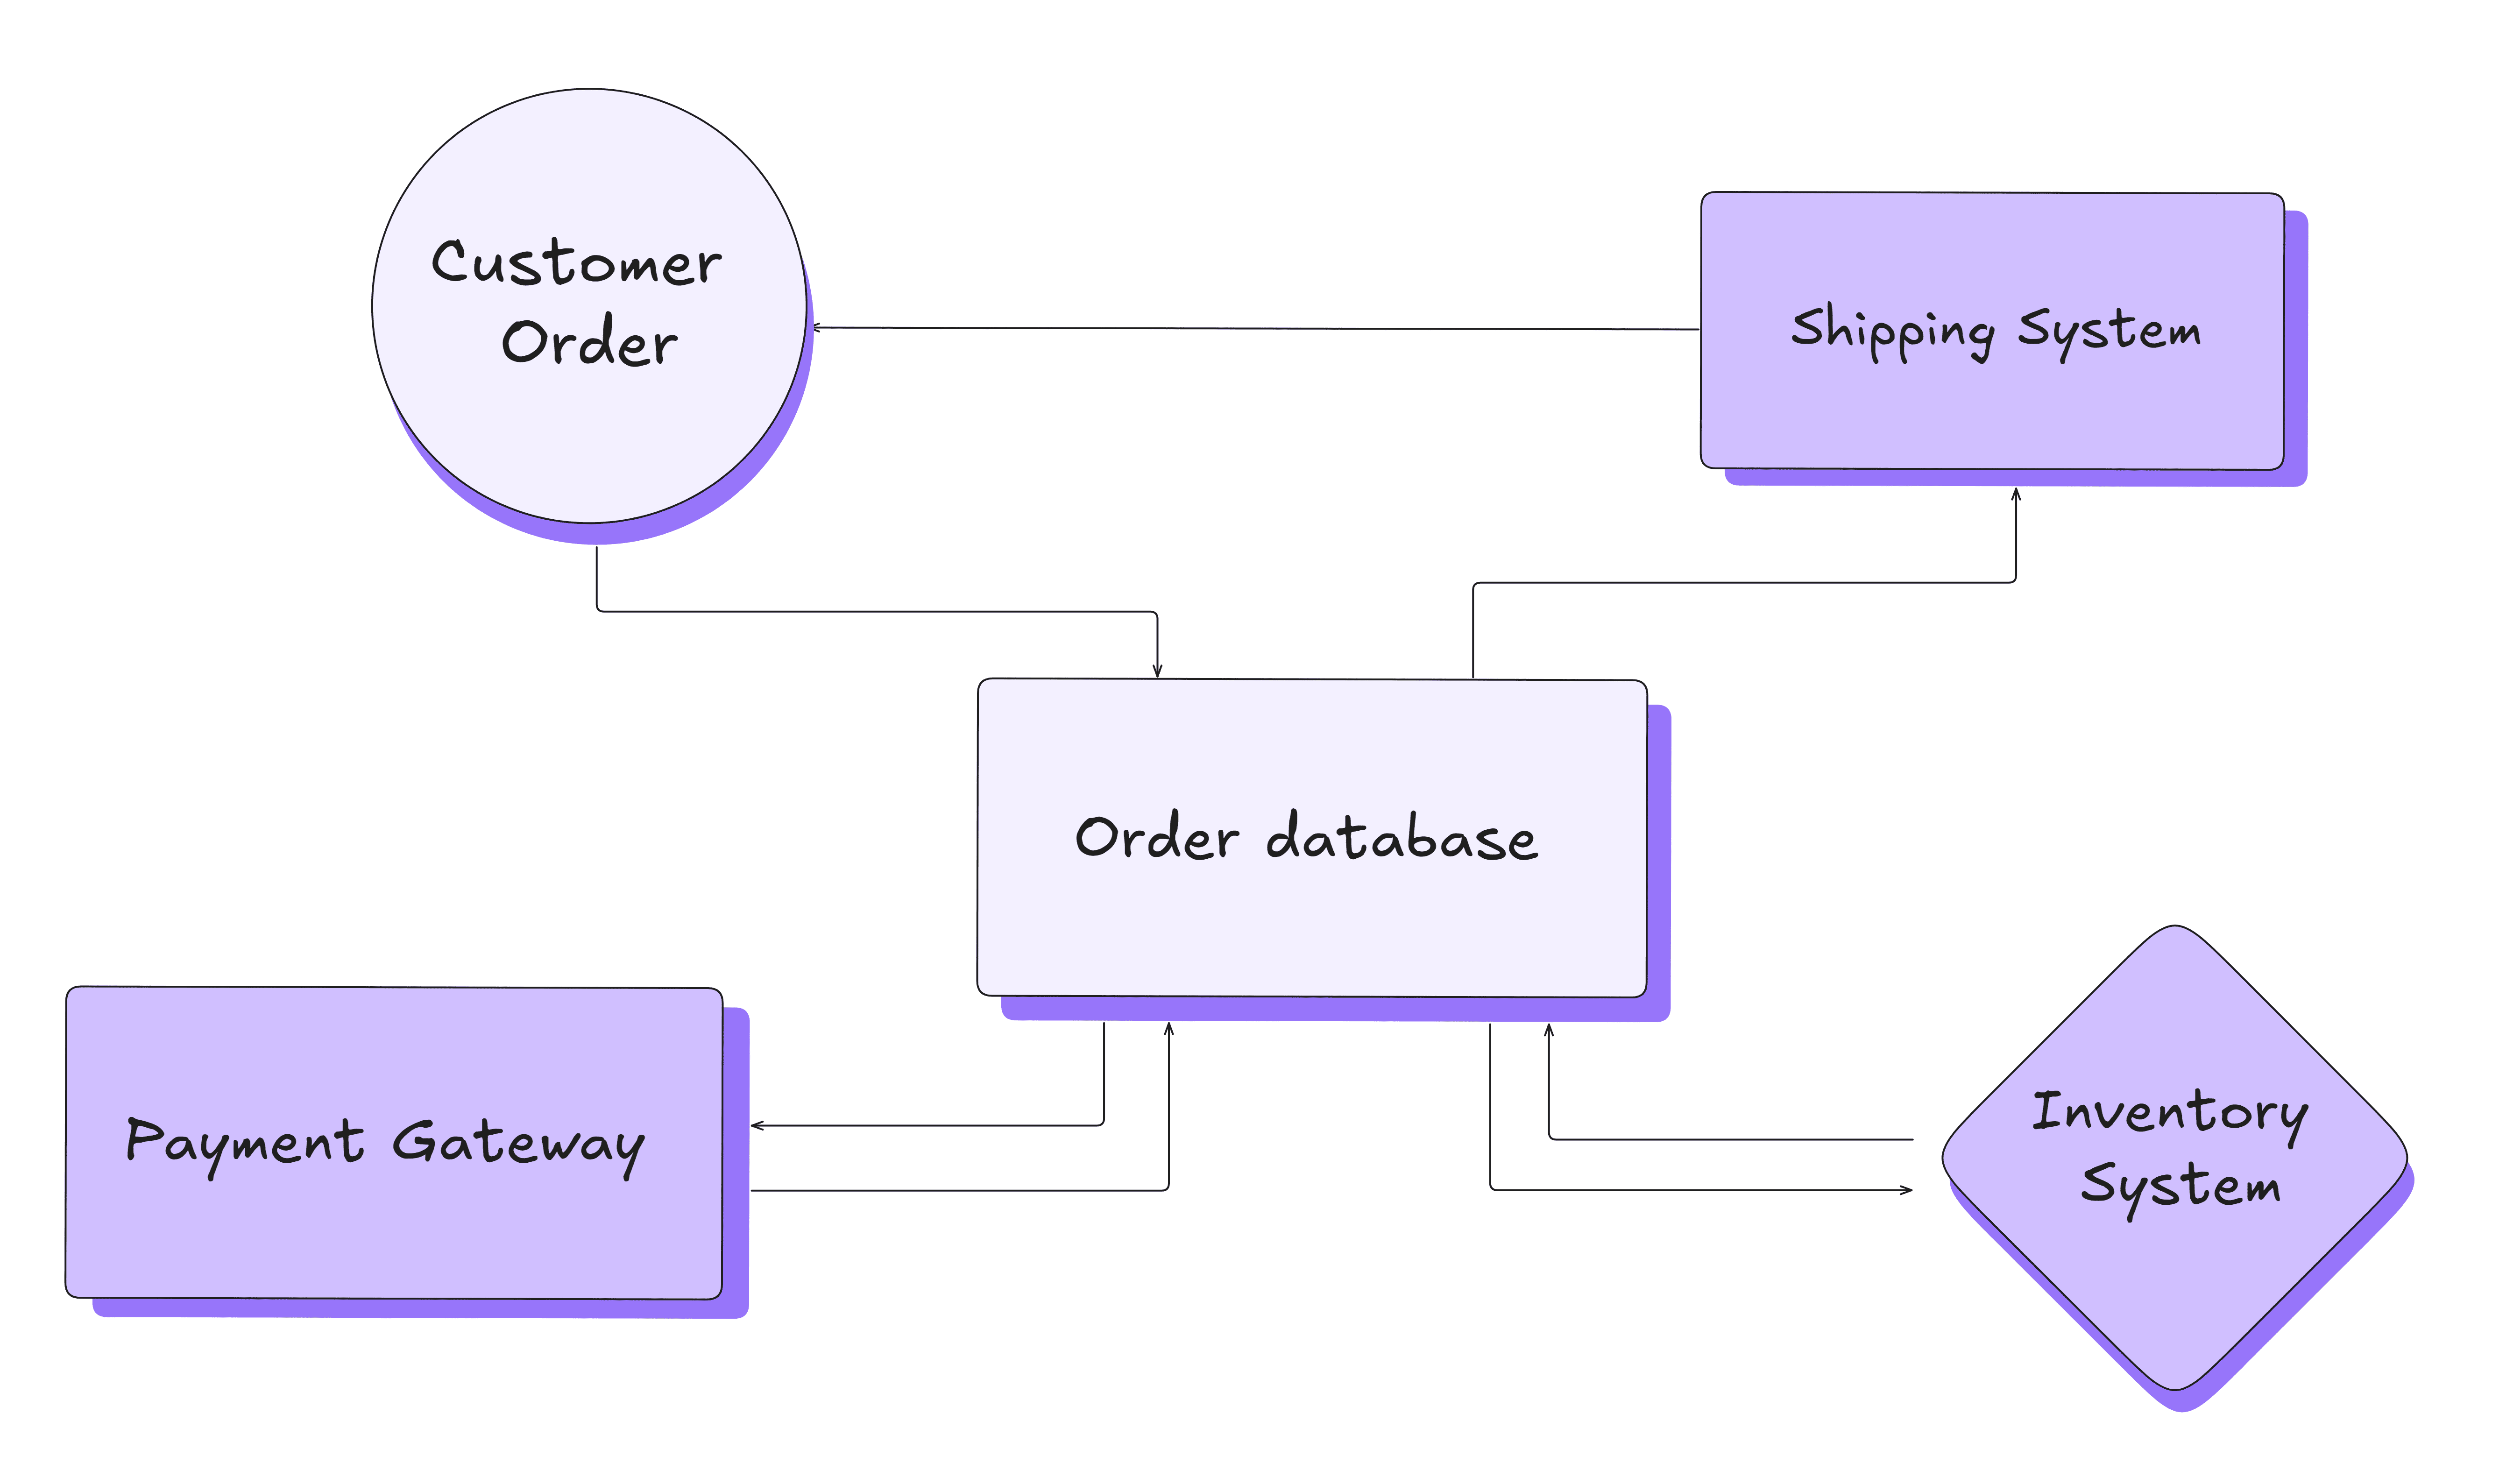
Data Flowchart
A data flowchart focuses on the movement and storage of data within a system. Useful in visualizing data systems and how information flows through various components.

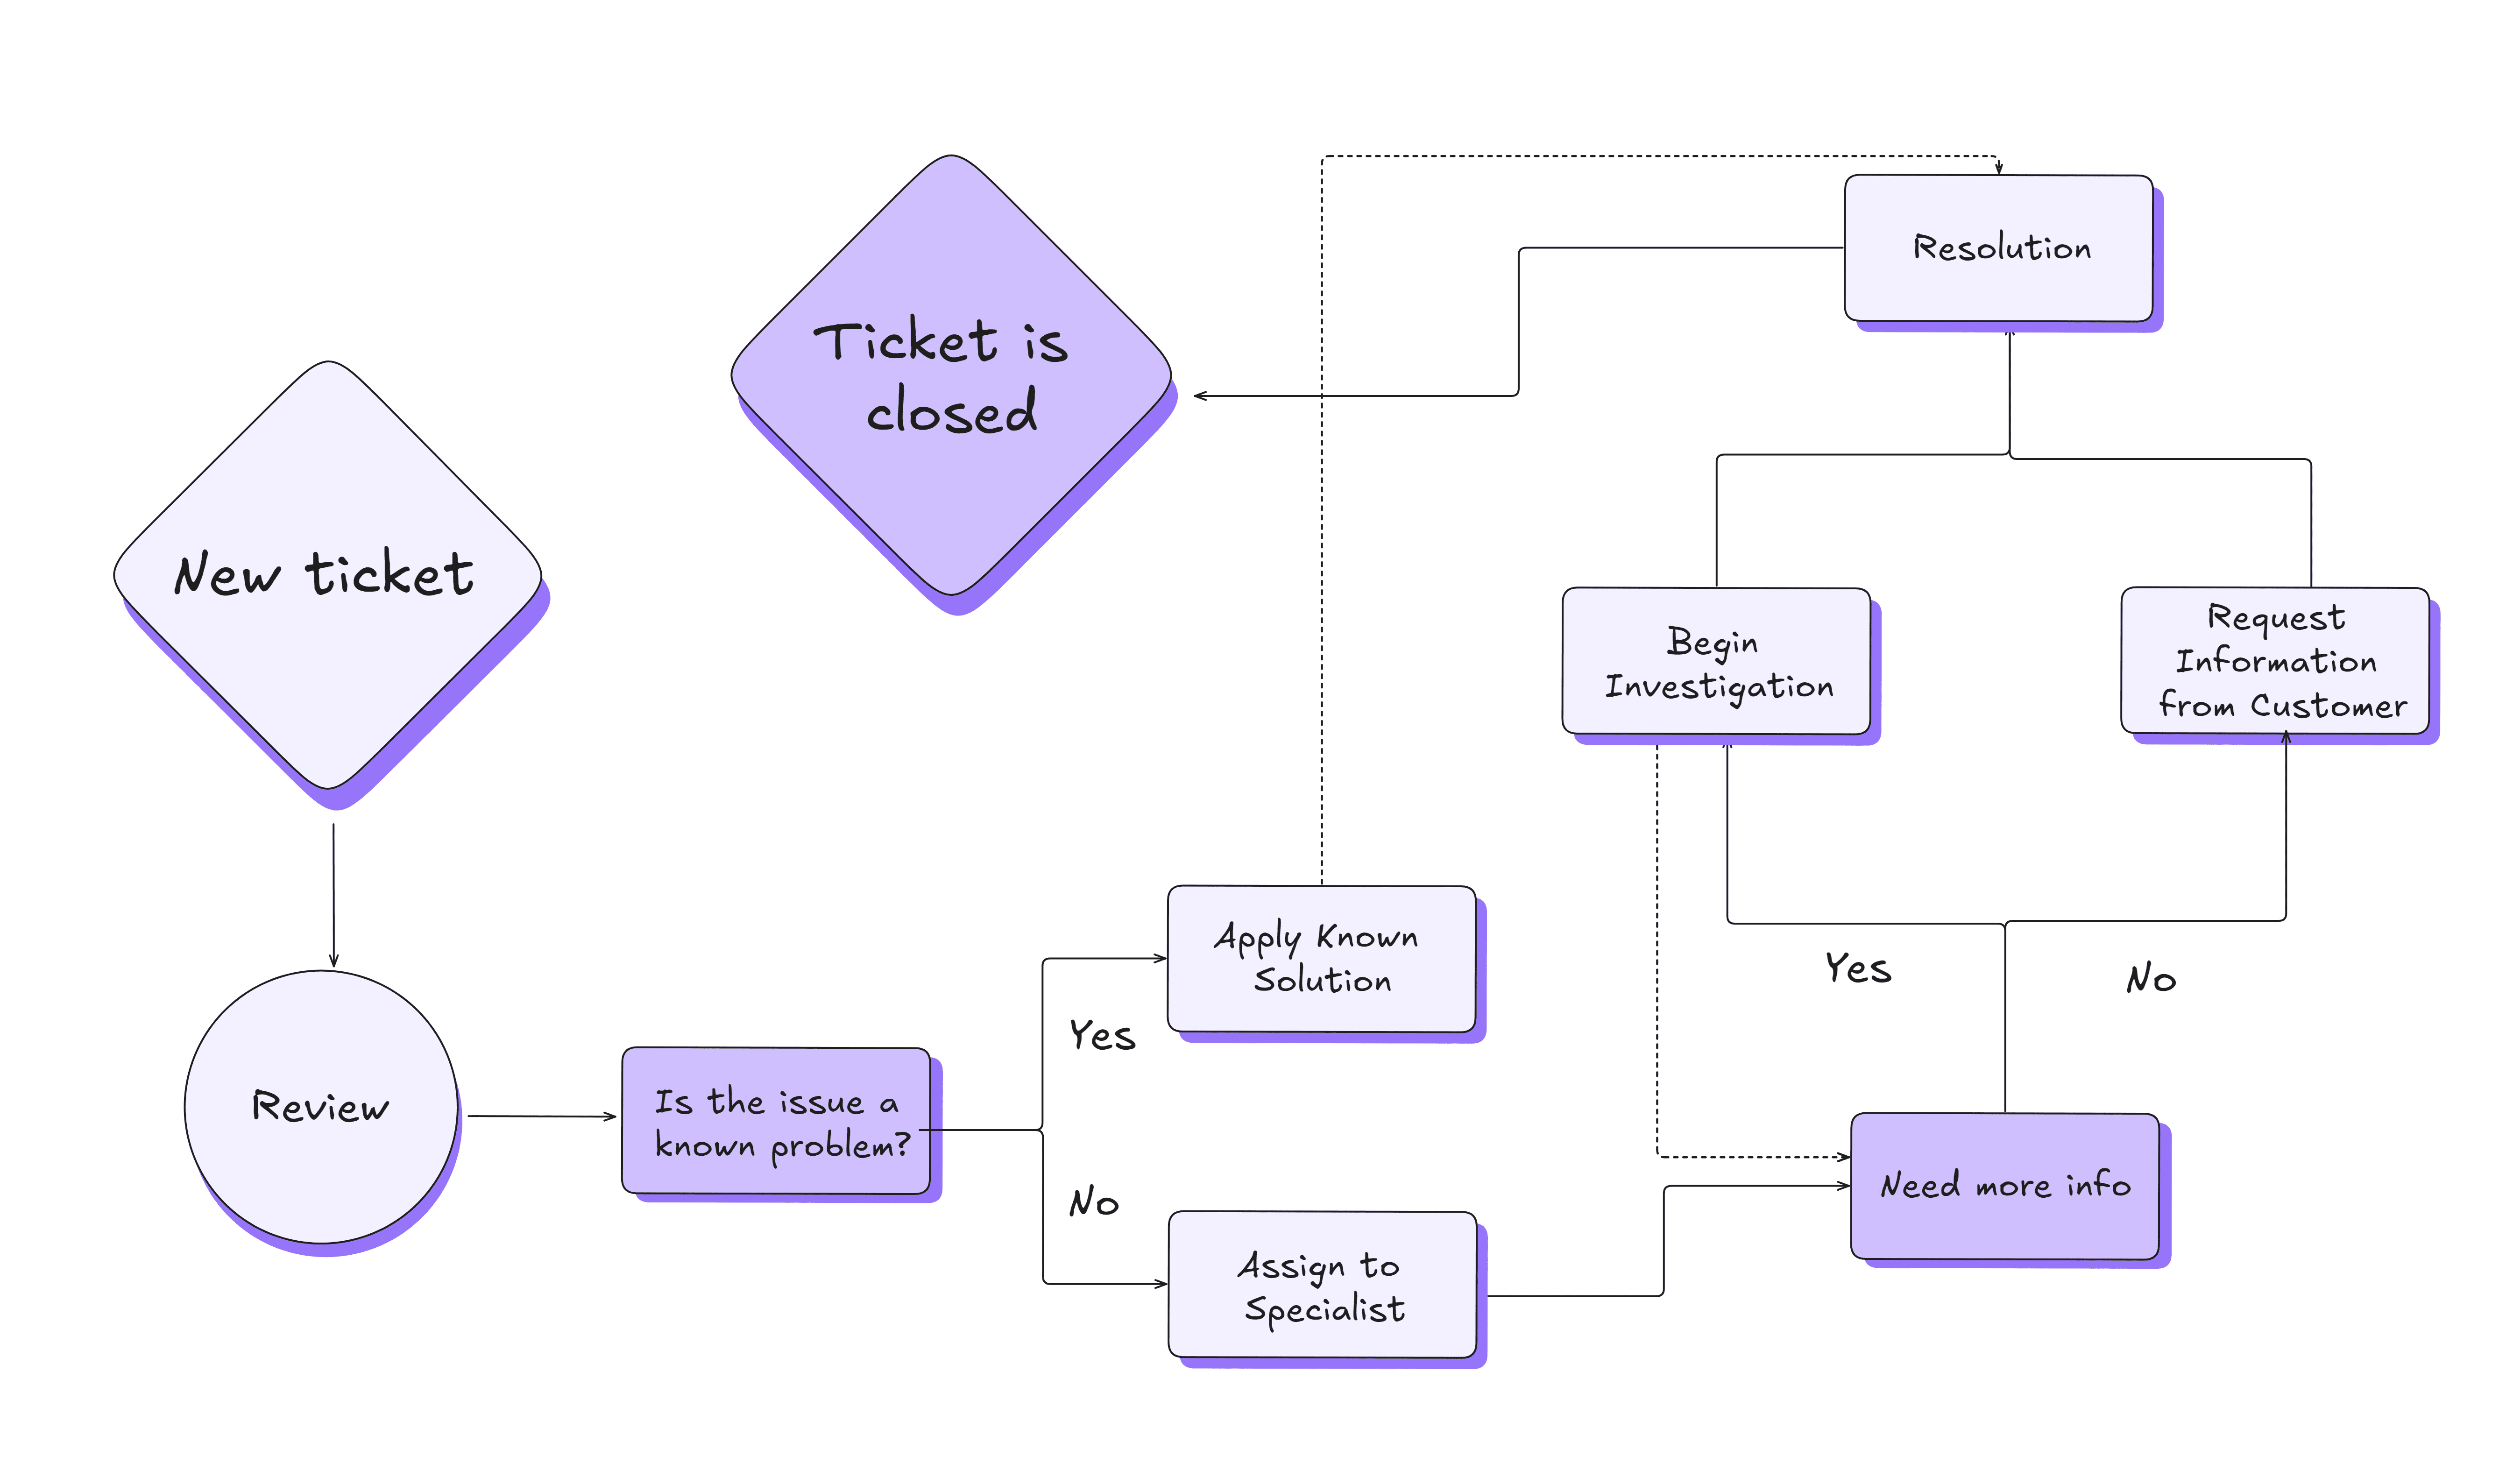
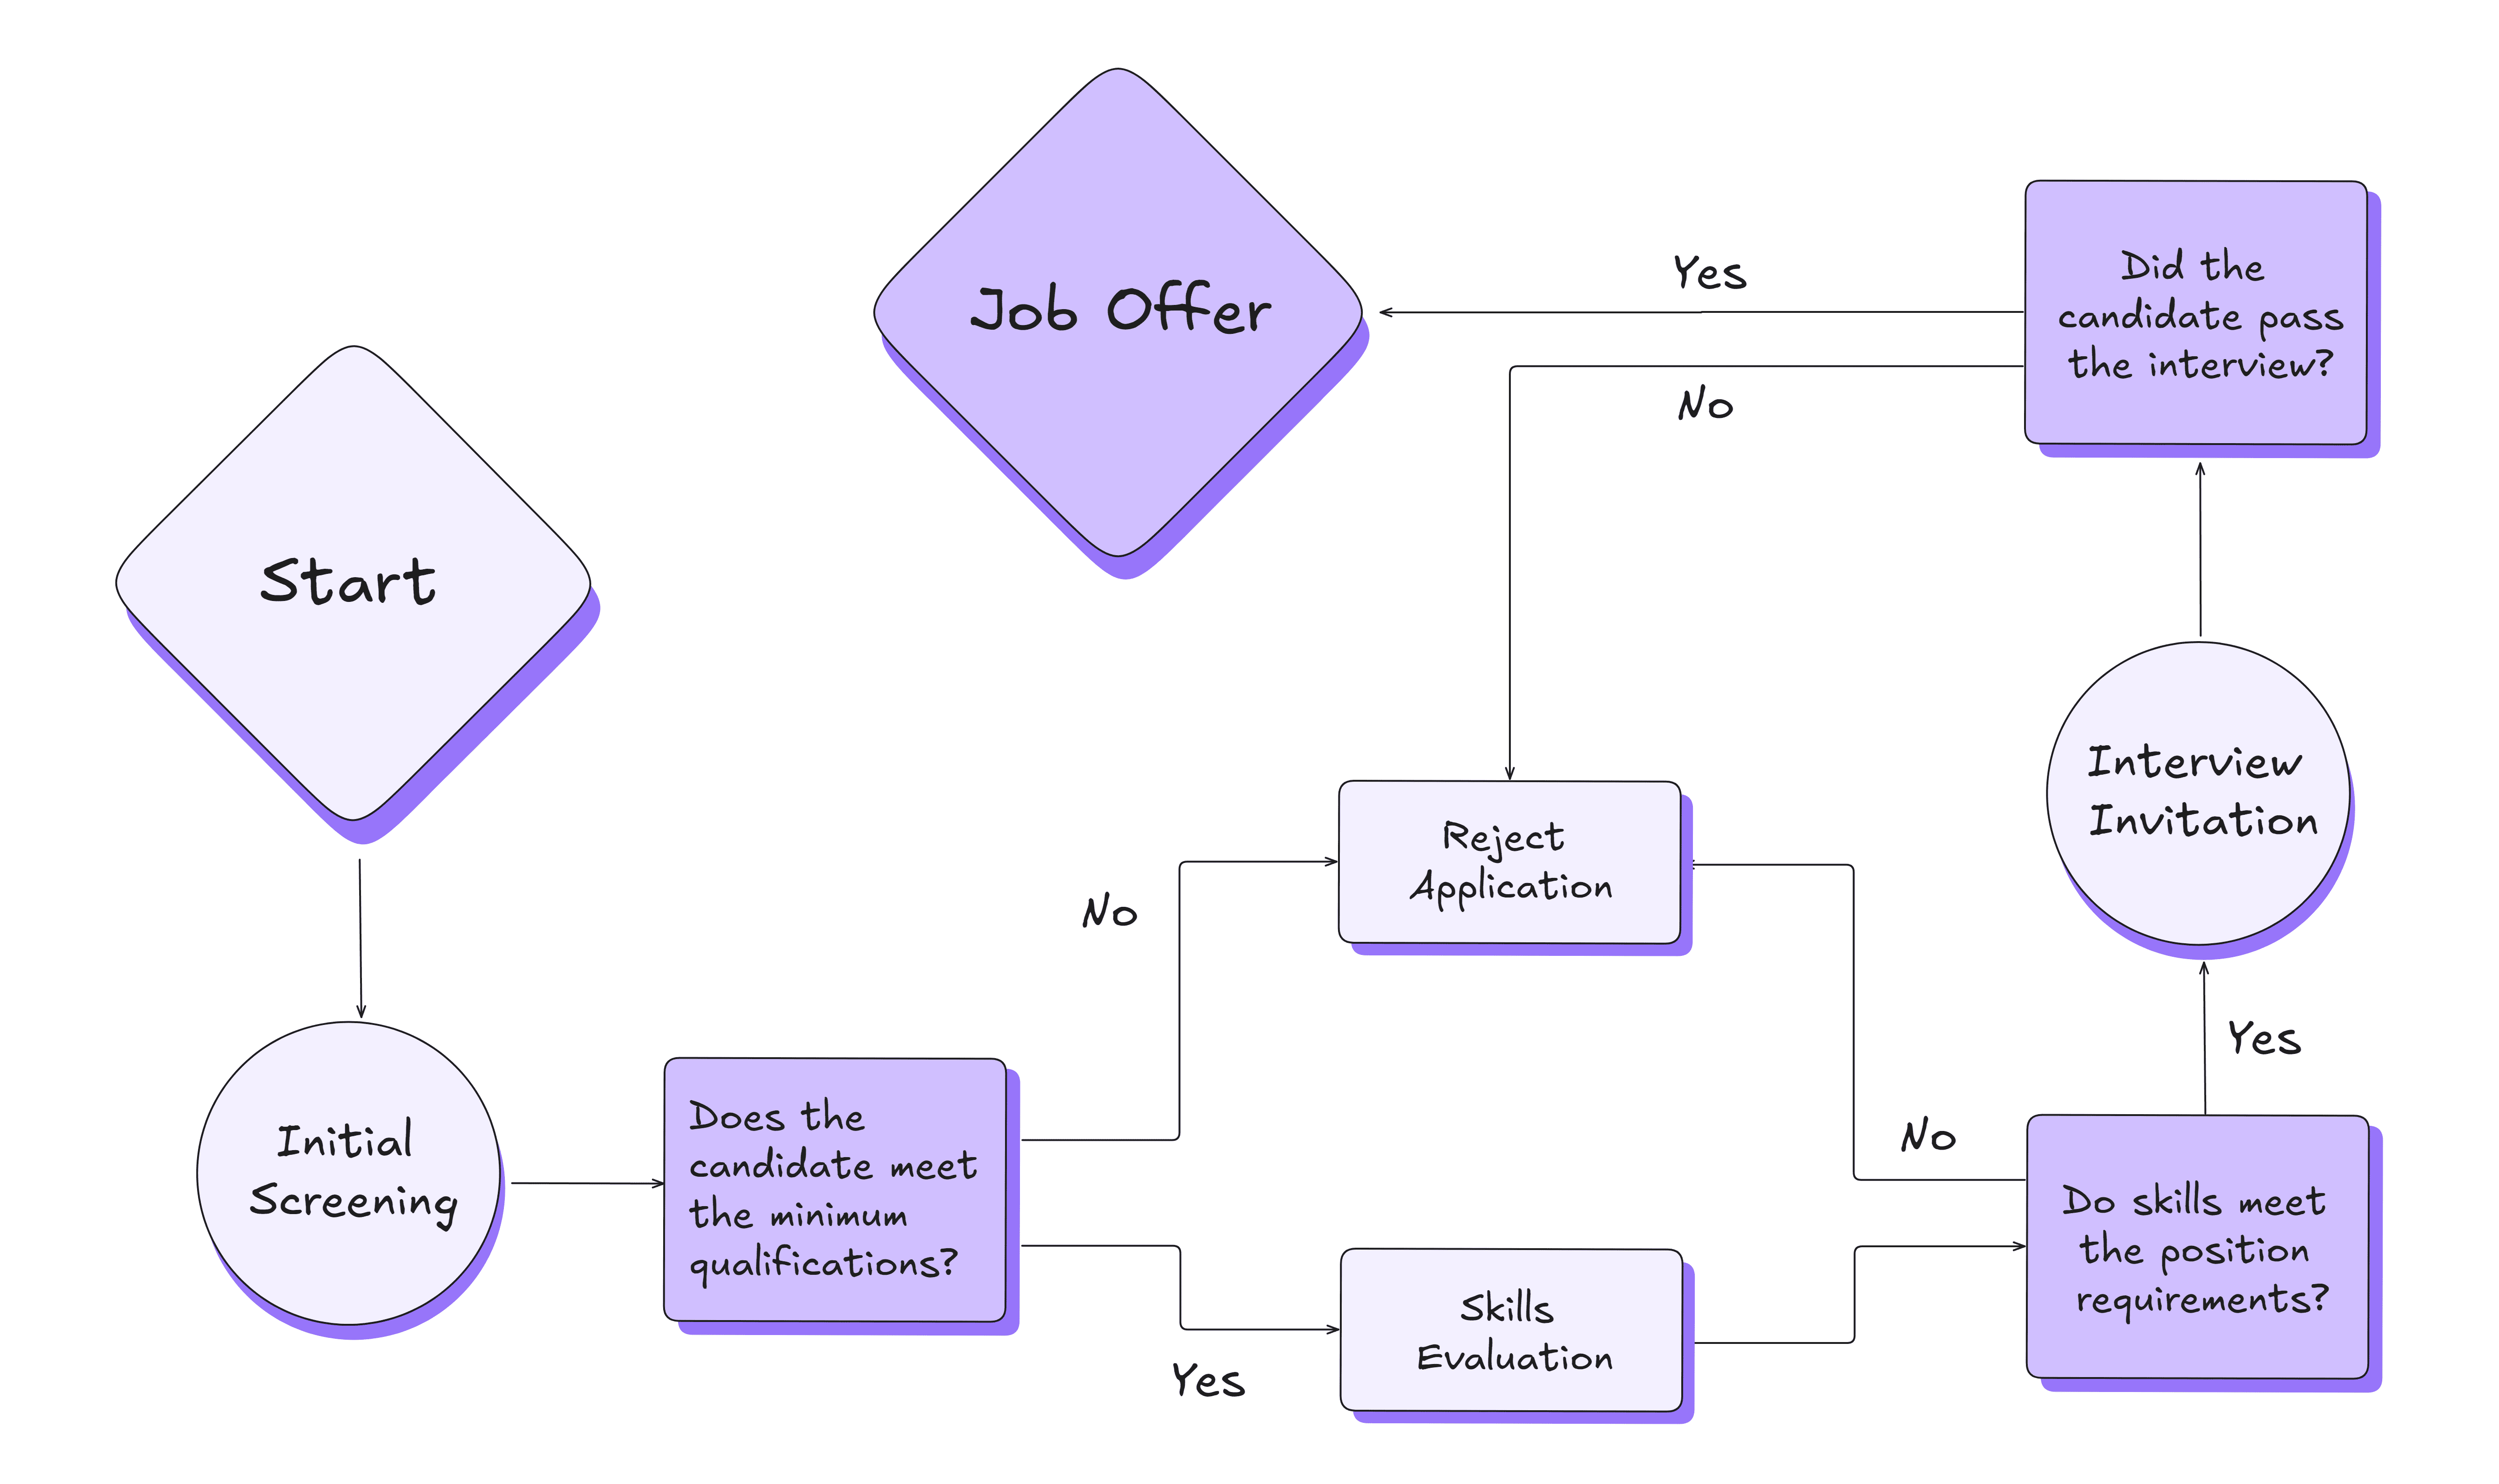
Decision Flowchart
A decision flowchart highlights decision-making paths through a series of yes/no questions that lead to different outcomes. It’s great for troubleshooting, diagnostics, or any process that involves decision-based branching.
Summary
Flowcharts simplify complex procedures and visualize decision paths in a clear and concise way.
They are used in process improvement, mapping out systems, conducting quality control, training new employees, and other systematic processes.

Specific Examples and Use Cases for Different Professions
Project Managers
Use process flowcharts to oversee project timelines and responsibilities.
Data Analysts
Employ data flowcharts to visualize data movements and storage solutions.
Software Developers
Utilize decision flowcharts to outline code logic, simplifying debugging and development.
Educators
Teach problem-solving and decision-making skills using simple flowcharts.
Best Tips and Tricks for Creating Flowcharts
Best Practises for Designing Flowcharts
- Keep Flowcharts Simple: Focus on the essential steps and keep the design uncluttered.
- Use Consistent Symbols: Standardize the symbols used across your flowcharts to maintain clarity and prevent confusion.
- Iterate Frequently: Update your flowcharts as processes change to keep them relevant and useful.
- Engage Stakeholders: Involve all relevant parties in the flowchart creation process to ensure accuracy and buy-in.
Common Mistakes to Avoid
- Overcomplicating the Flowchart: Adding too many details or branching can confuse rather than clarify.
- Lacking Clear Direction: Ensure that the flow direction is intuitive and that the flowchart is easy to follow.
- Ignoring Feedback: Not incorporating feedback from users of the flowchart can result in a tool that is not fit for purpose.
Tips for Making Flowcharts in Excalidraw
- Use shortcuts like Cmd/Ctrl+Arrow to create nodes or hold Cmd/Ctrl while pressing Arrow repeatedly to create multiple nodes at once.
- Create read-only links to incorporate flowcharts into your documentation and simplify their updates.
- Write prompts and let AI create a flowchart for you.
- Search in Libraries or create a new one for frequently used flowchart symbols.
- Incorporate feedback or suggestions using comments.
Use Shortcuts to Create a Flowchart
Cut on clicks with keyboard shortcuts. Give it a try by pressing ...
- R to choose and create a rectangle.
- Enter to type text and Esc when finished.
- Cmd/Ctrl+Arrow to create flowchart nodes. Repeat.
- Tab to change the shape to a diamond or an ellipse as you go.
- Opt/Alt+Arrow to move around.
- Shift+1 to zoom to fit all elements.
- ? to explore all shortcuts.
PLUS
In Excalidraw, you can collaborate on flowcharts with your team in real-time, share via simple links for immediate feedback, and utilize versatile export options. Try Excalidraw+ for PLUS features like comments, read-only links, extra AI prompting, presentation tool, and more.


