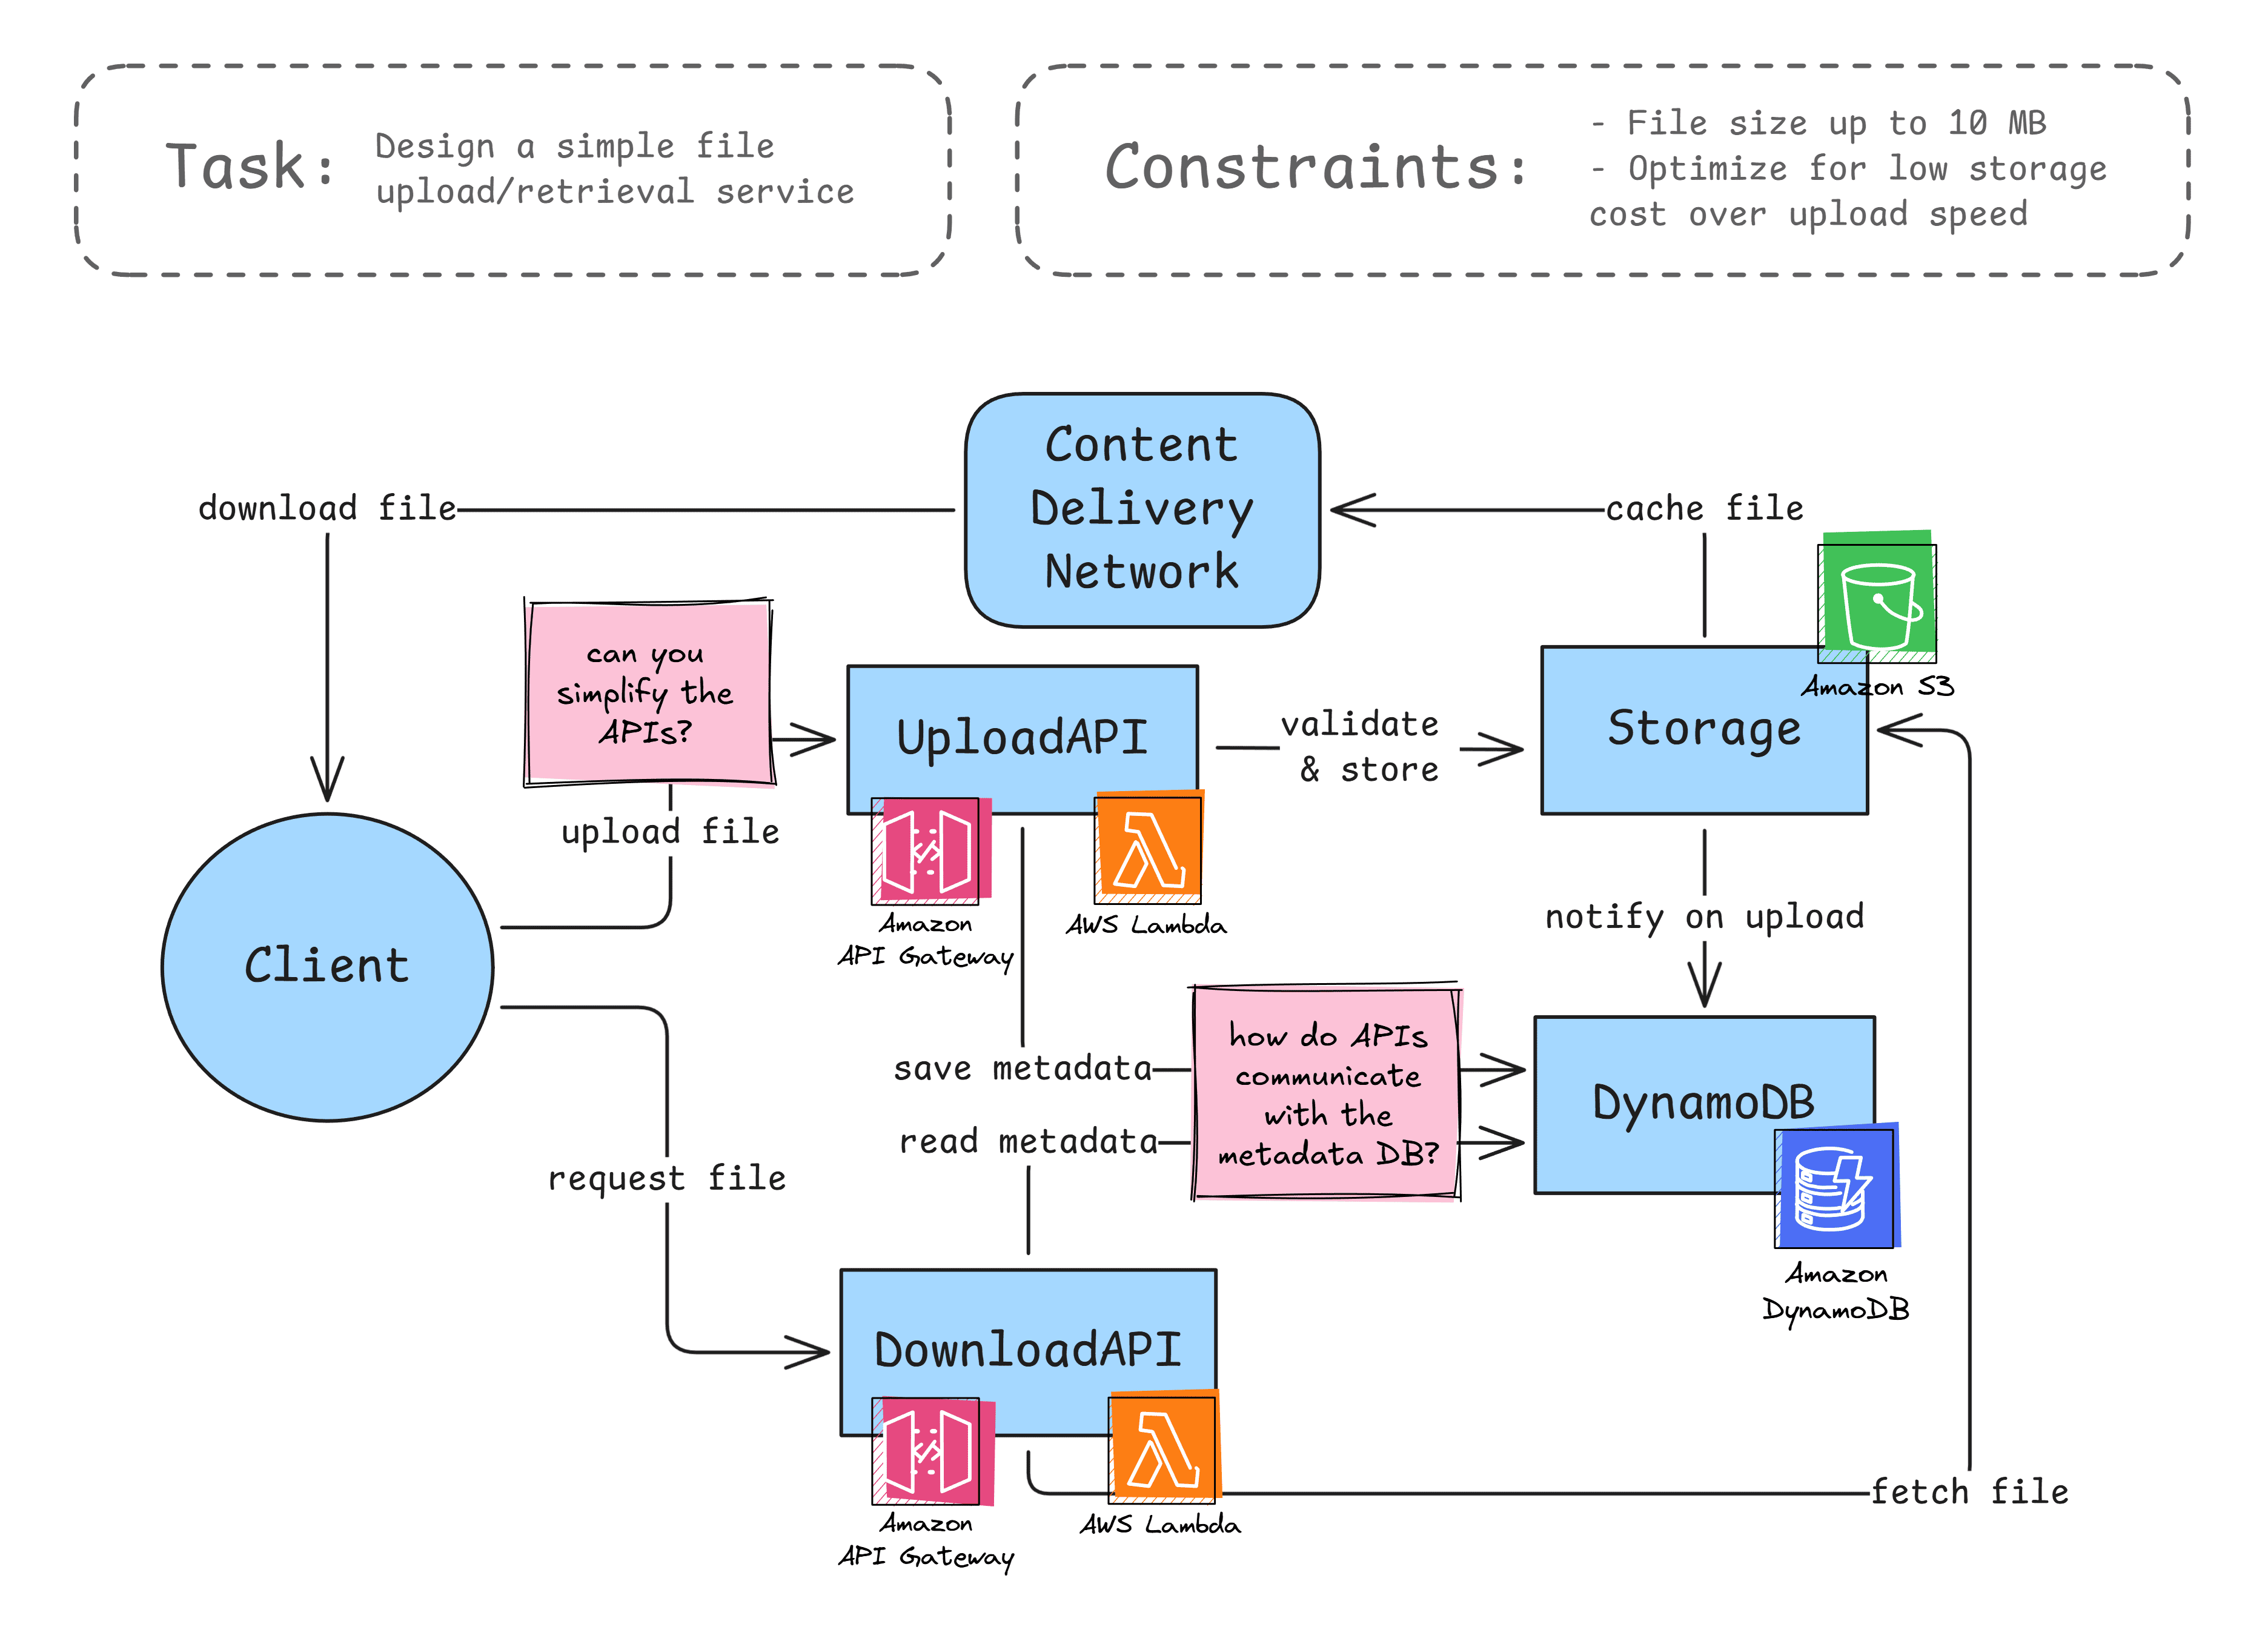
Job Interviews and Hiring
Run and practice system design and whiteboarding interviews. Create collaborative workspaces to manage hiring in Excalidraw.
"I don't want to sound crazy, but we use Excalidraw for virtually everything."

Run and practice system design and whiteboarding interviews. Create collaborative workspaces to manage hiring in Excalidraw.
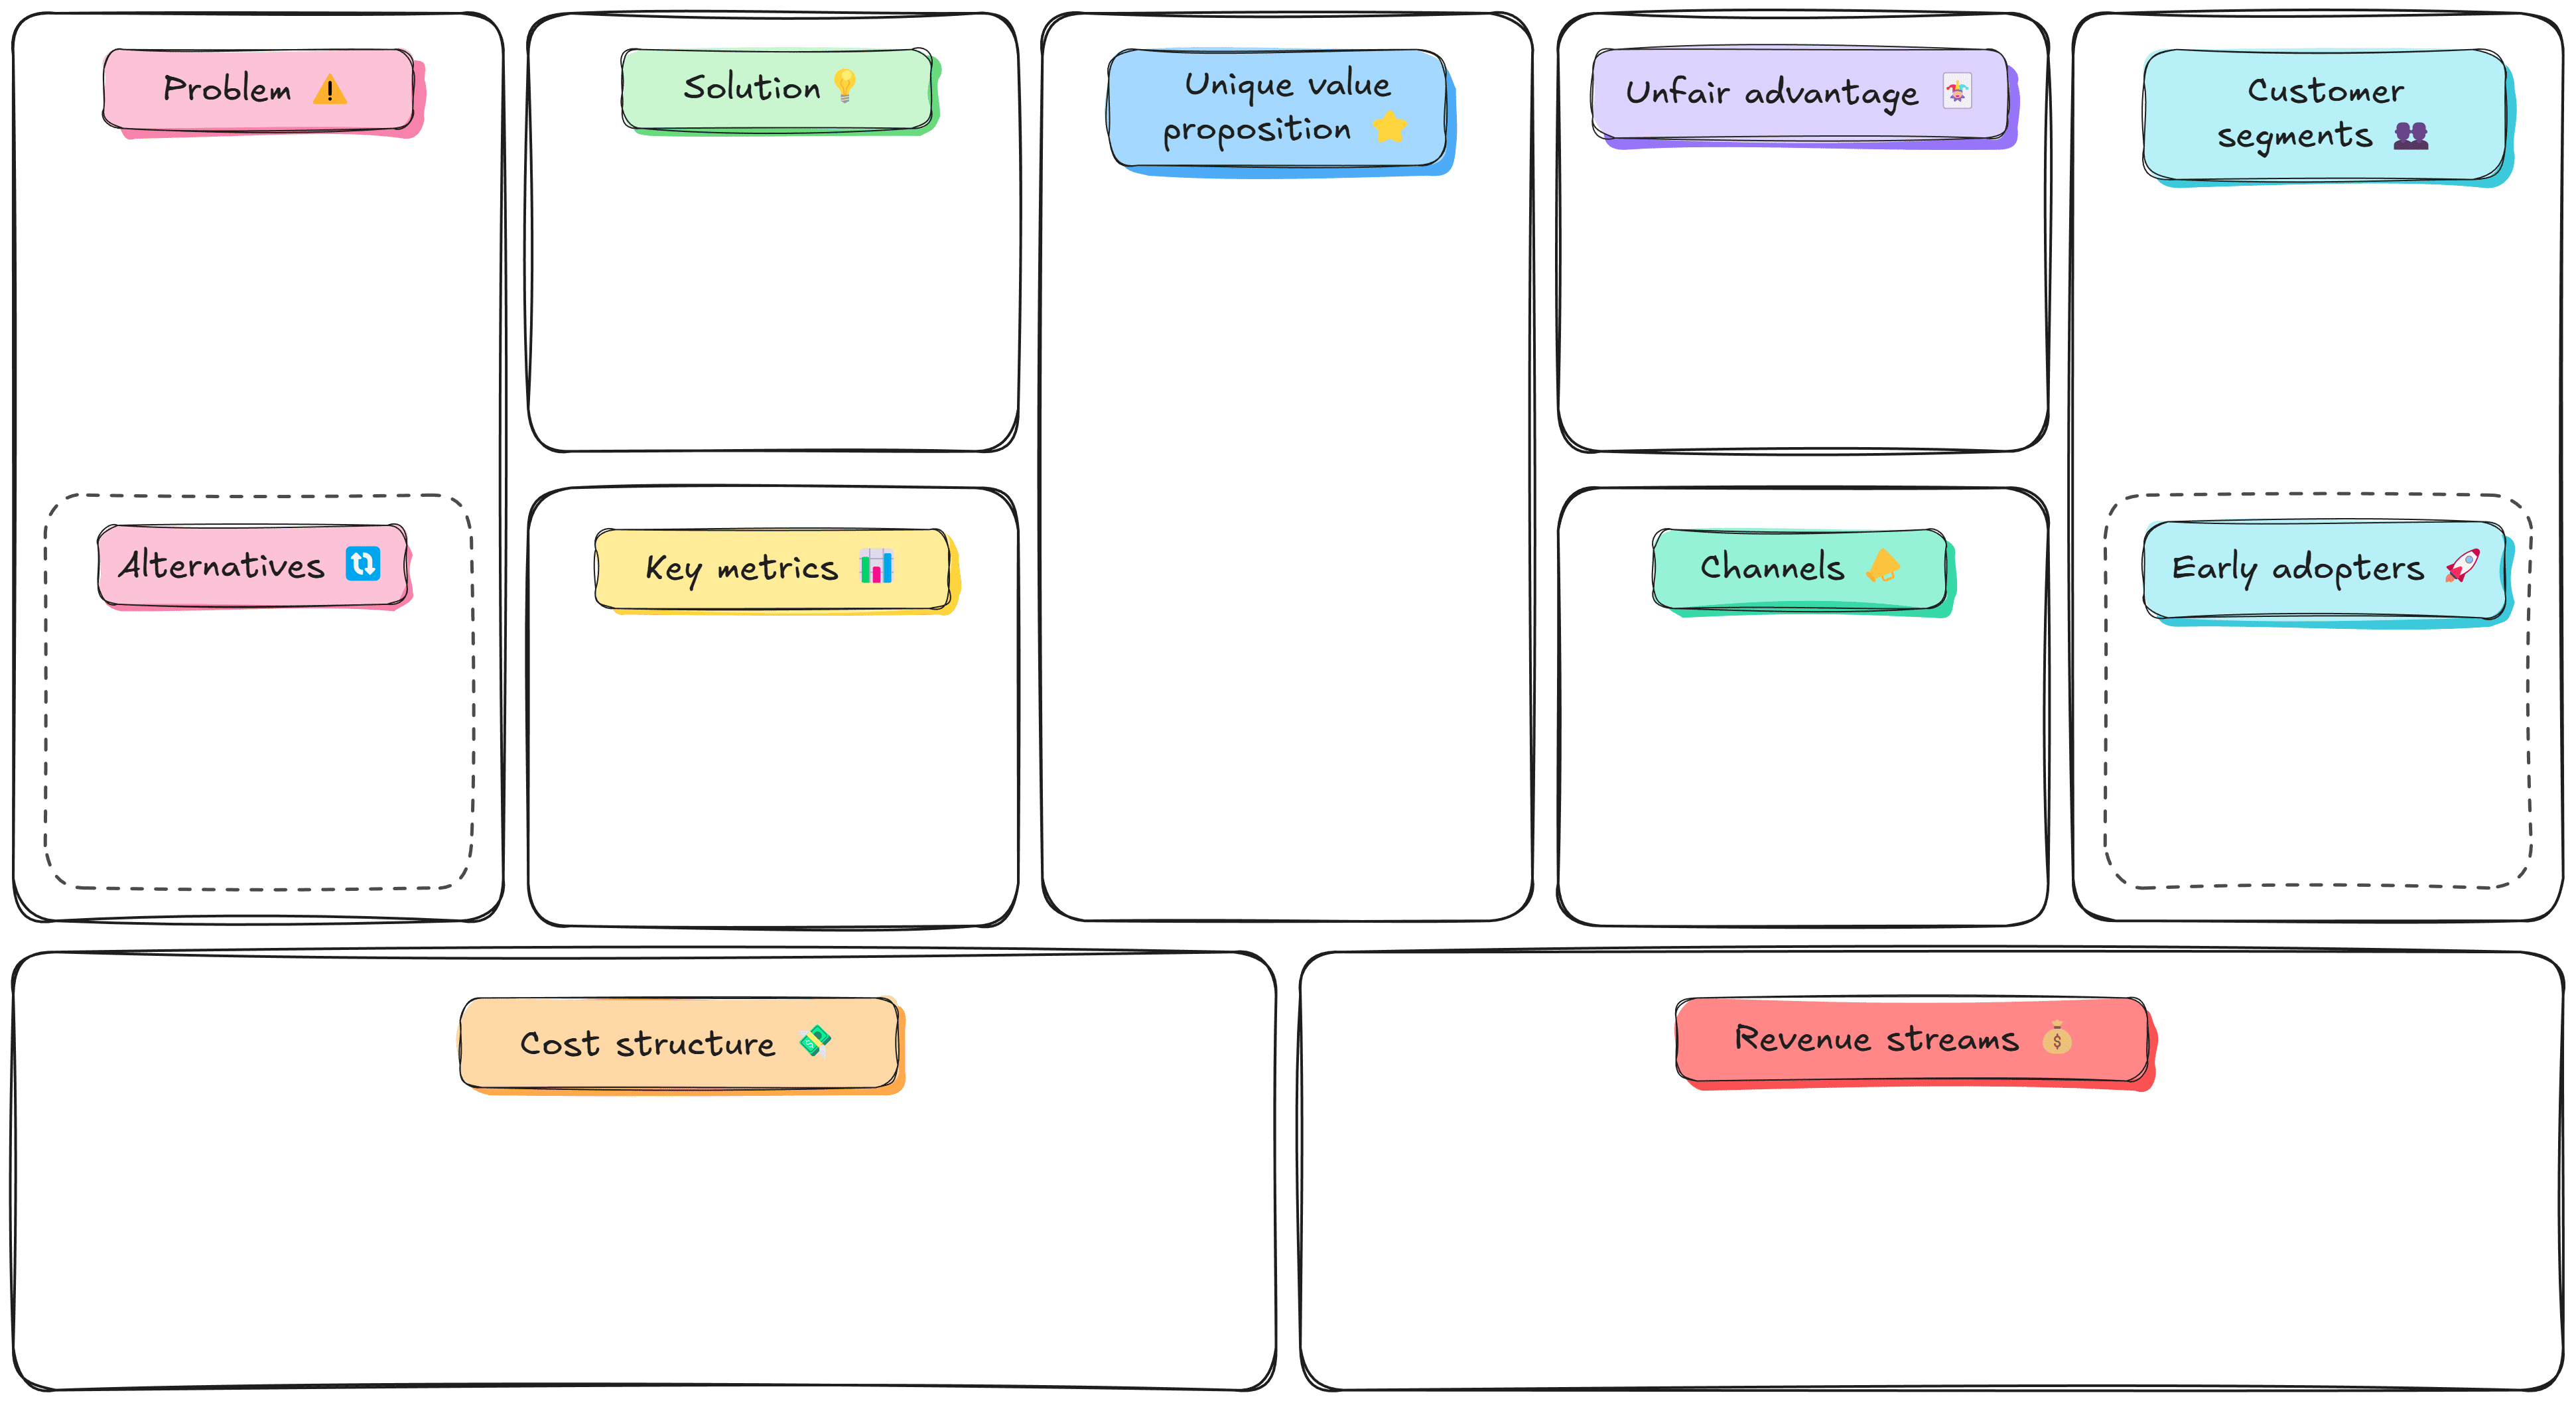
Map key aspects of your business. Iterate and improve to build a roadmap for your startup in Excalidraw.
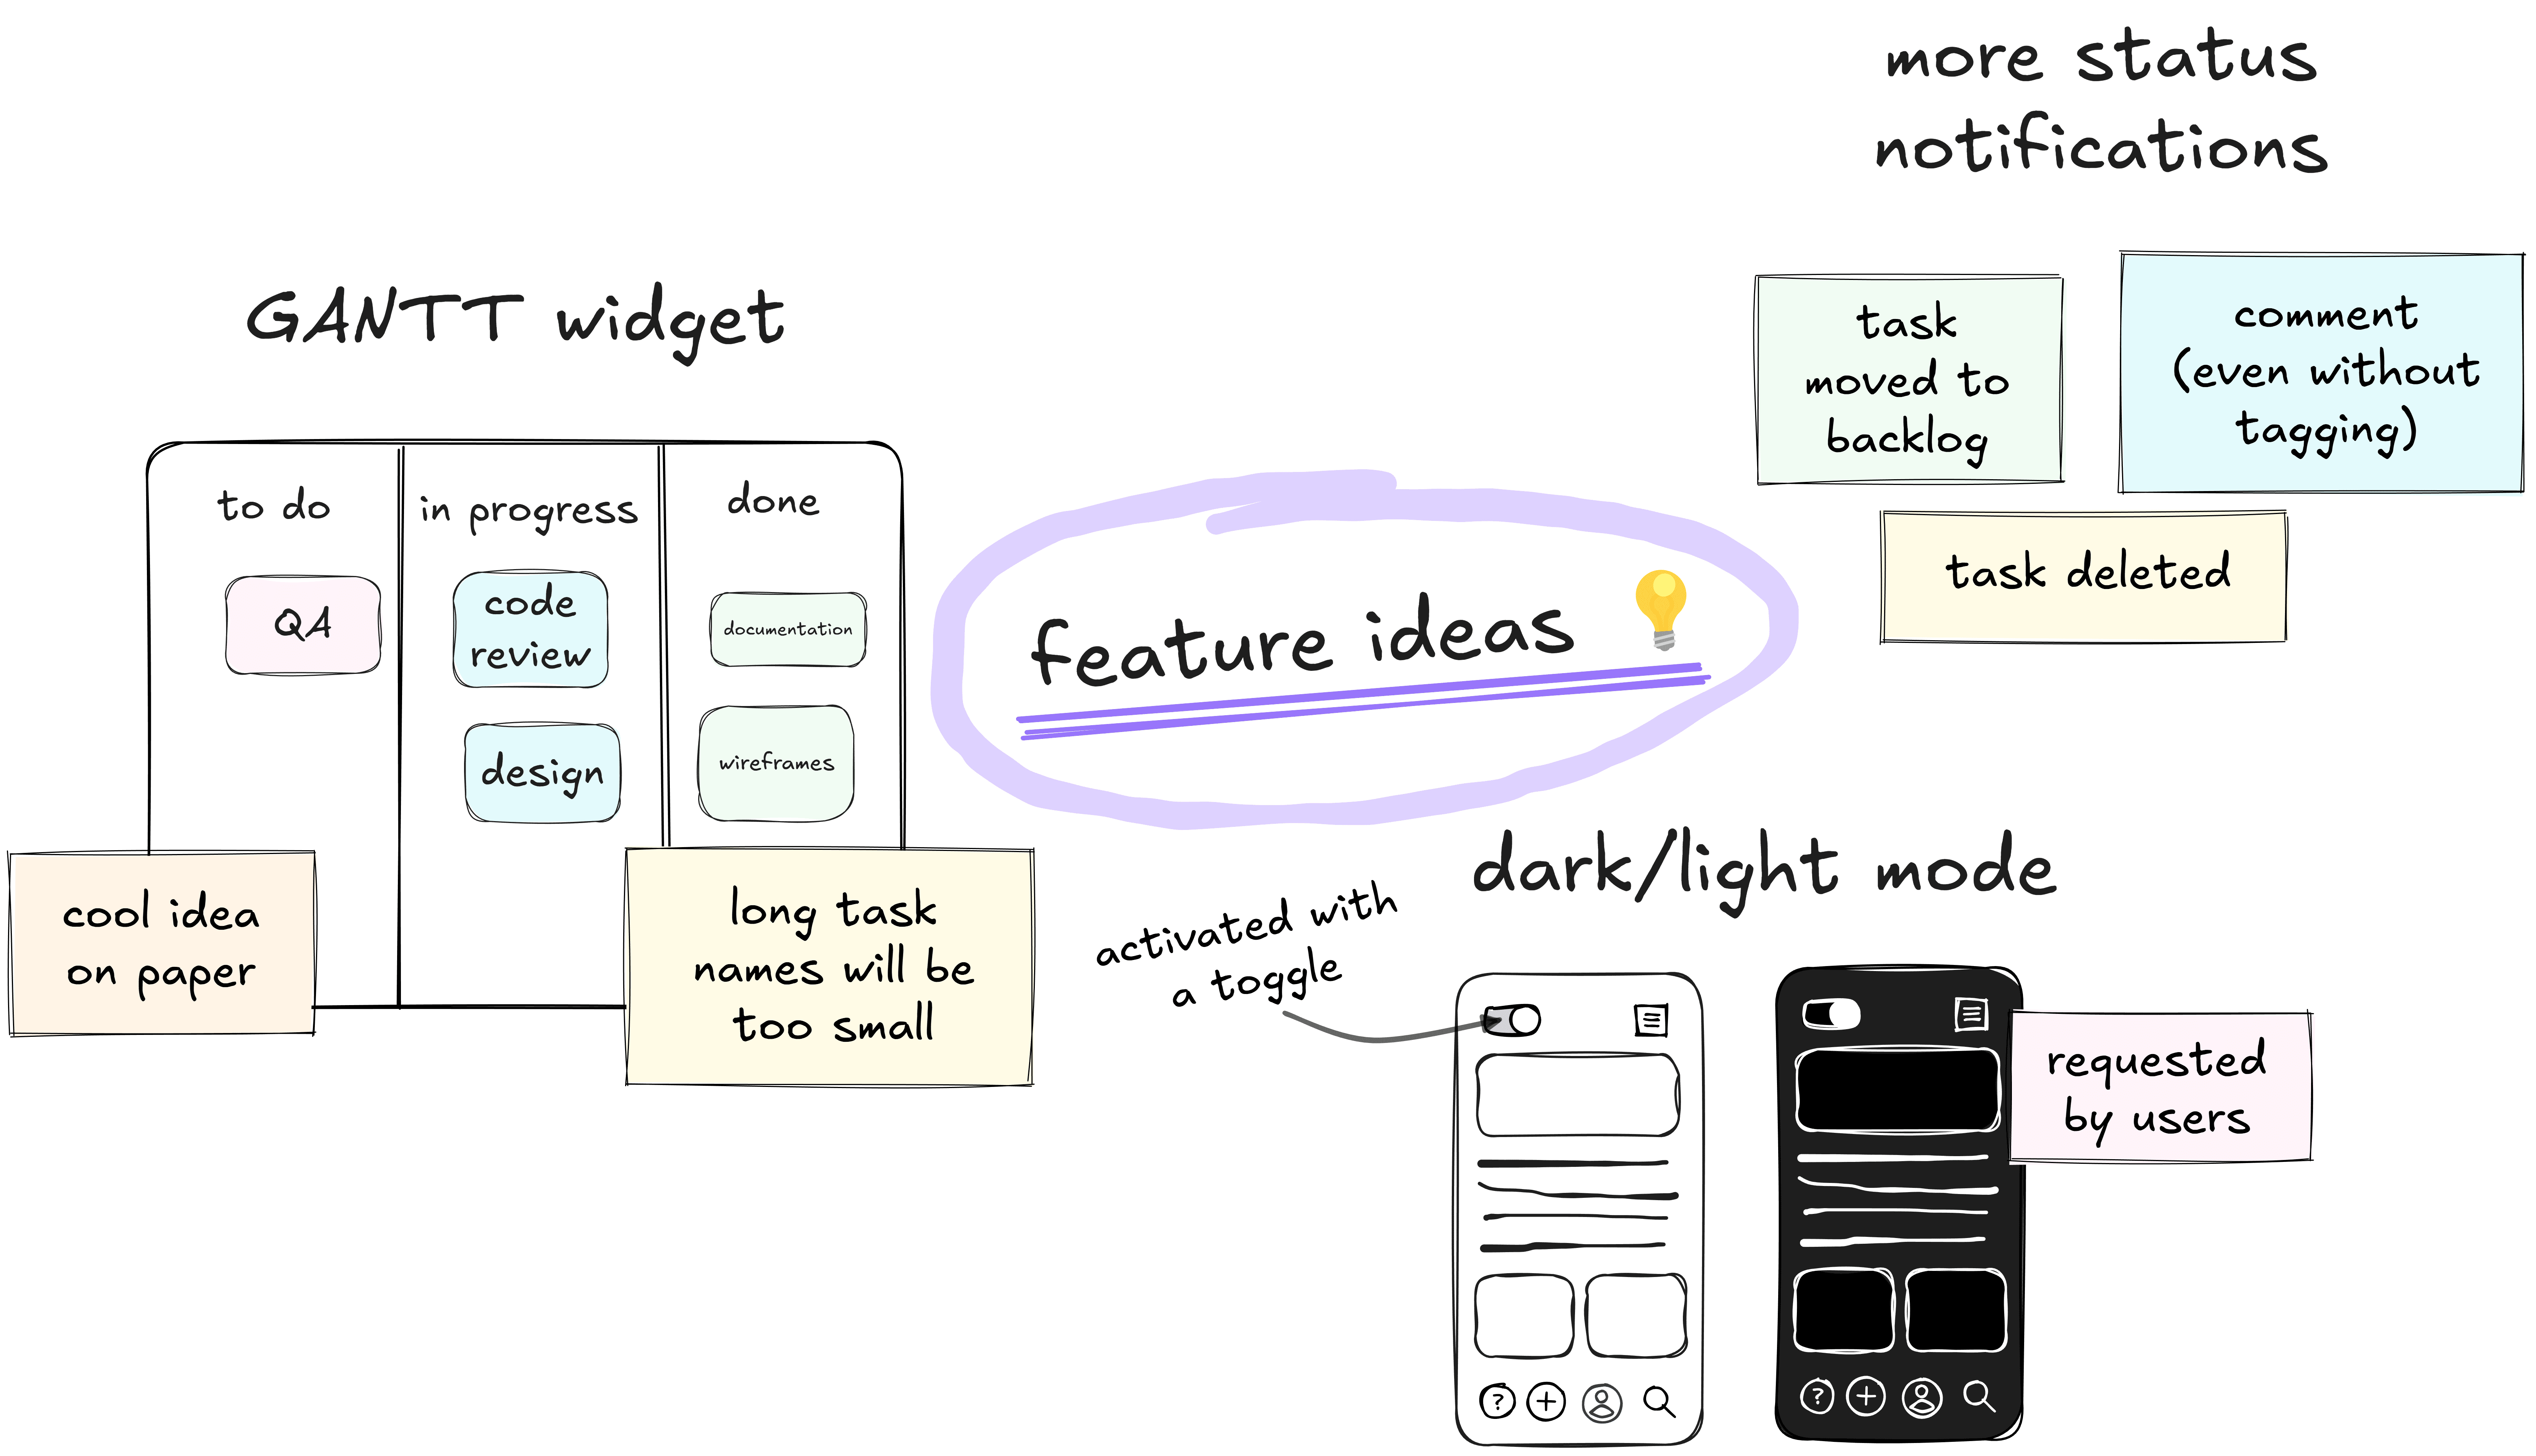
Generate, organize, and document ideas with your team using visual brainstorming techniques and Excalidraw's online whiteboard.
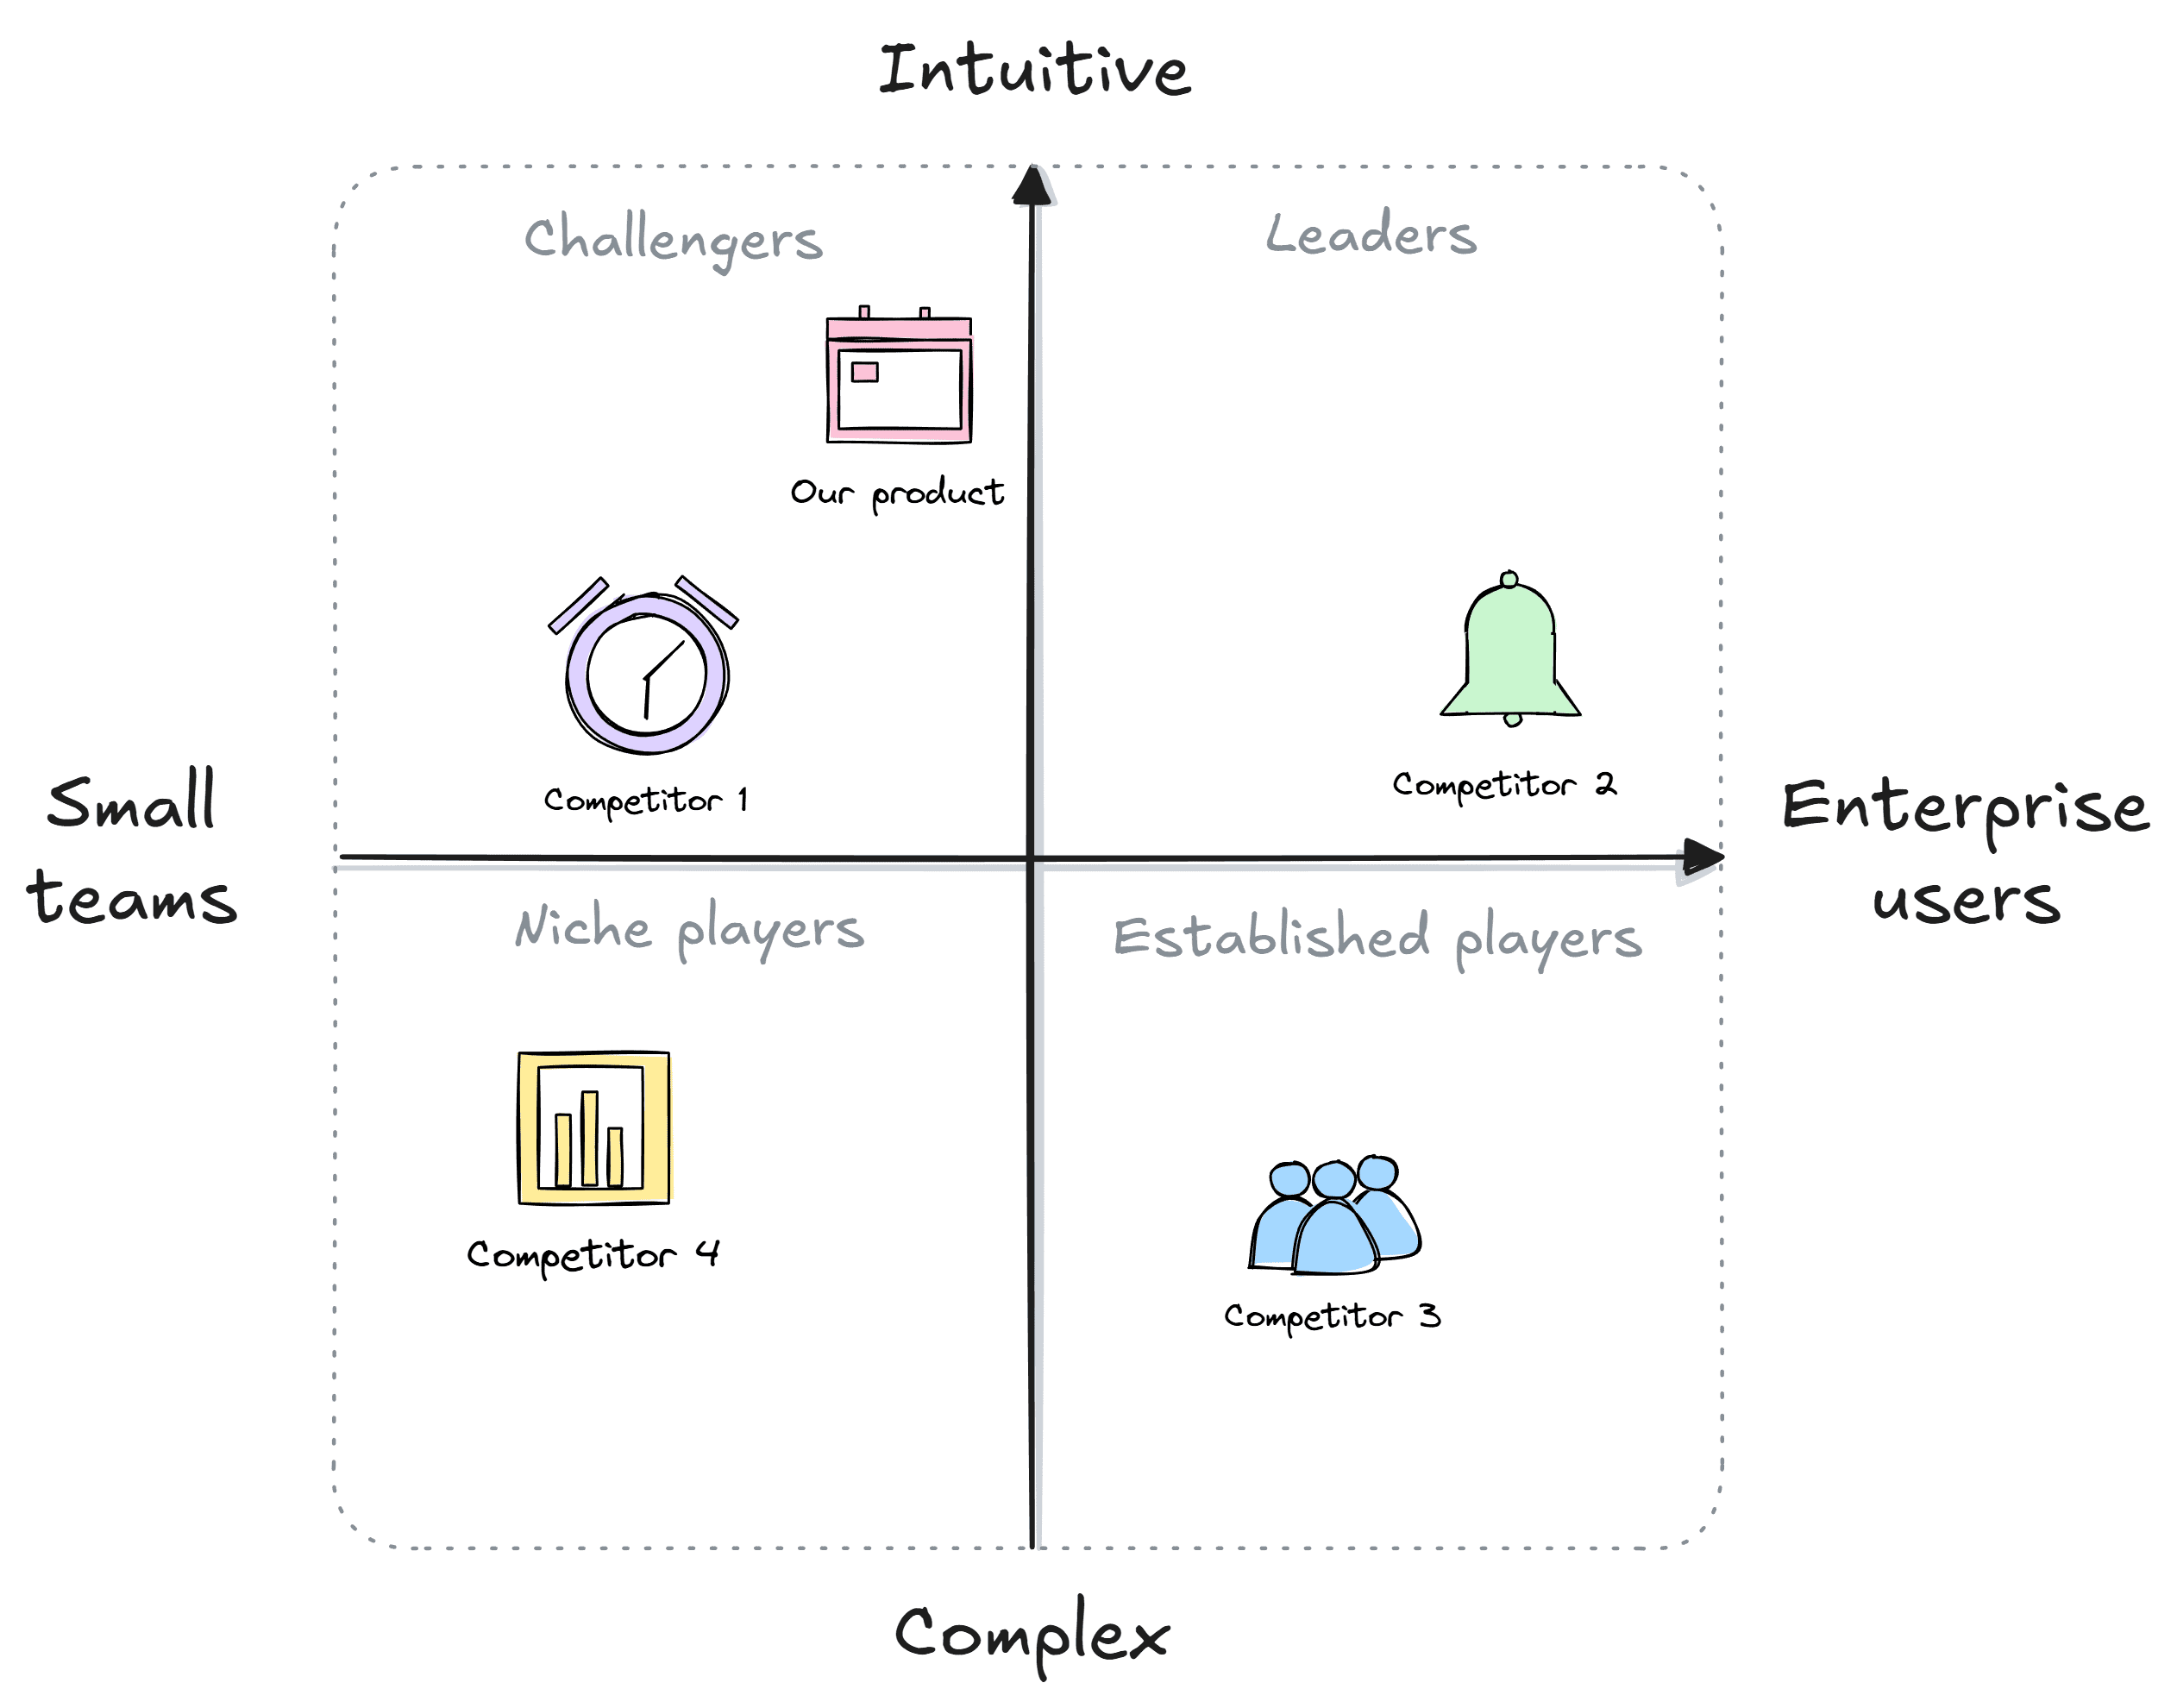
Gain a visual insight into your market, competition, and your own position. Set the course for your business strategy, starting with Excalidraw's collaborative whiteboards.
.png)
Map your strengths, weaknesses, opportunities, and threats. Start planning your next project visually with Excalidraw's online whiteboards.
.png)
Collect and organize ideas, build prototypes, visualize mechanics, and more. Create your next game with Excalidraw's collaborative whiteboards.
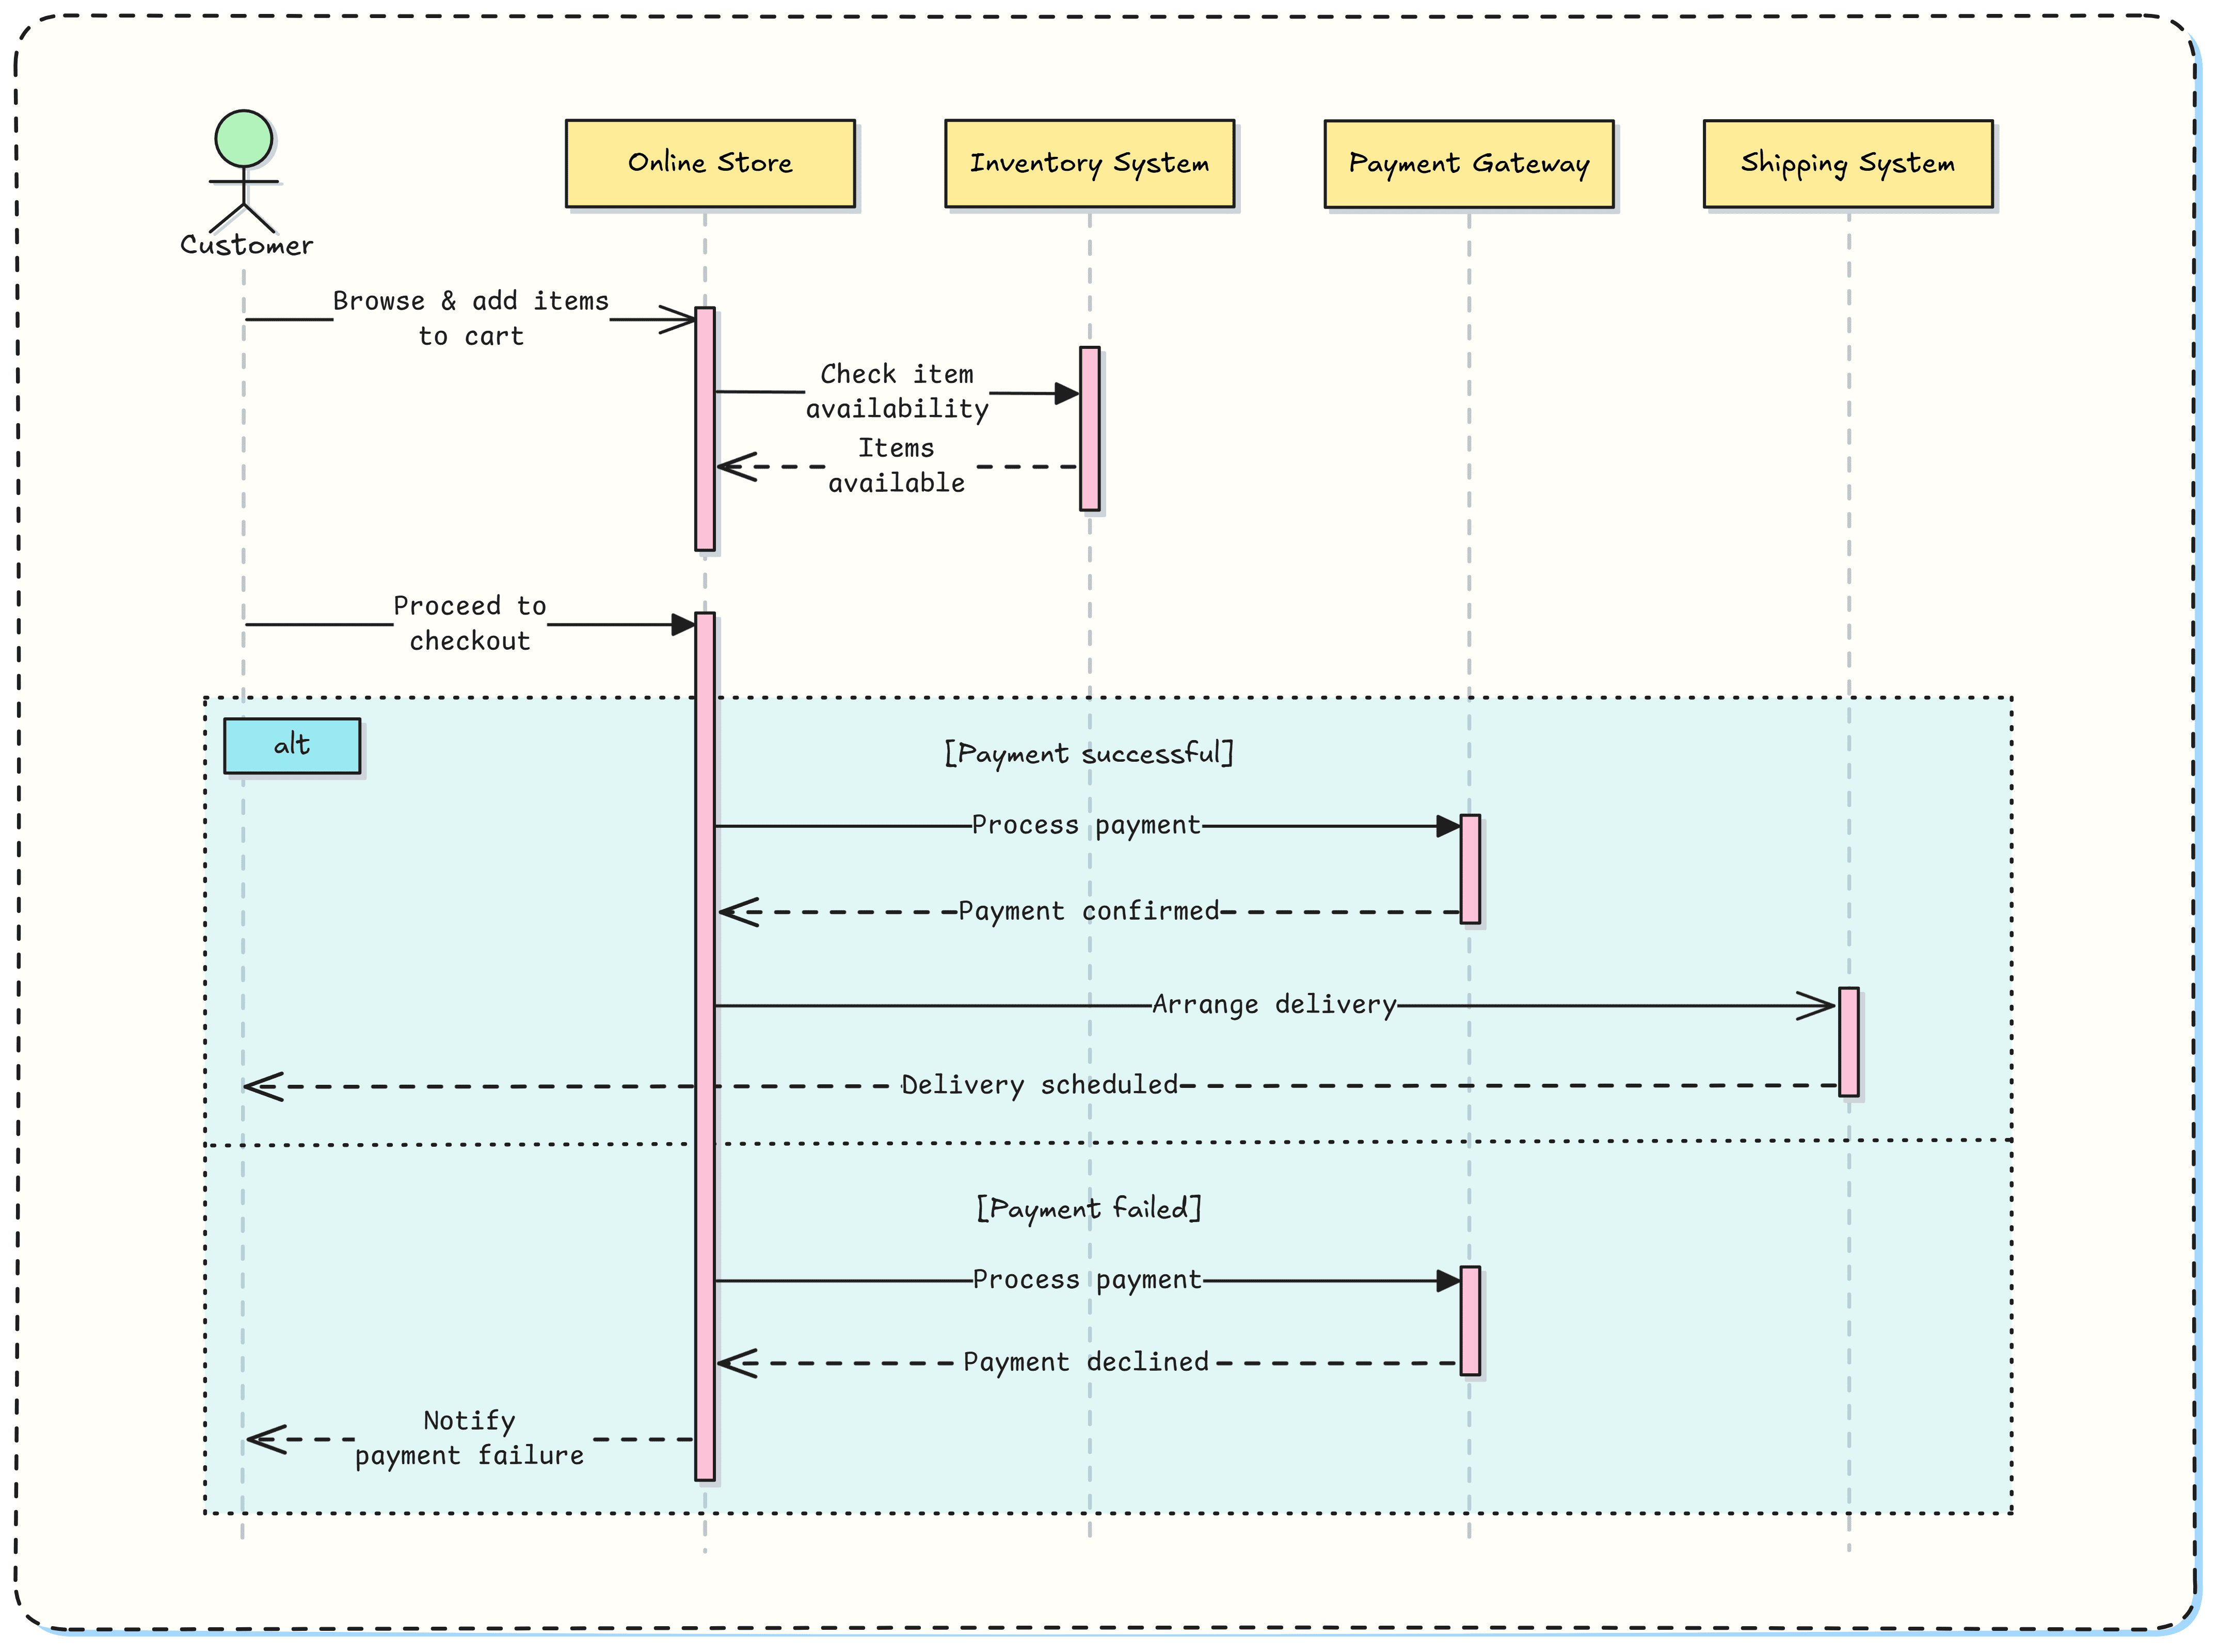
Visualize interactions within processes and systems. Draw sequence diagrams online with Excalidraw, a free, collaborative whiteboard tool.
.png)
Map the movement of data within systems in a simple, visual way using Excalidraw and data flow diagrams.
.png)
Create simple and clear user personas in Excalidraw to gain a better understanding of your target group's goals, needs, and challenges.

See the most common use cases of online whiteboard in education. Excalidraw is ideal for both teachers/educators and students for explaining complex concepts, real-time diagraming sessions, live presentations and more.

Create Mind maps, Tree maps, Spider maps, brainstorm, and draw in Excalidraw, a free online collaborative whiteboard.

Create Gantt charts using AI in Excalidraw, an easy-to-use, free, online whiteboard.

Create software architecture diagrams fast in Excalidraw, an easy-to-use, free, online whiteboard.
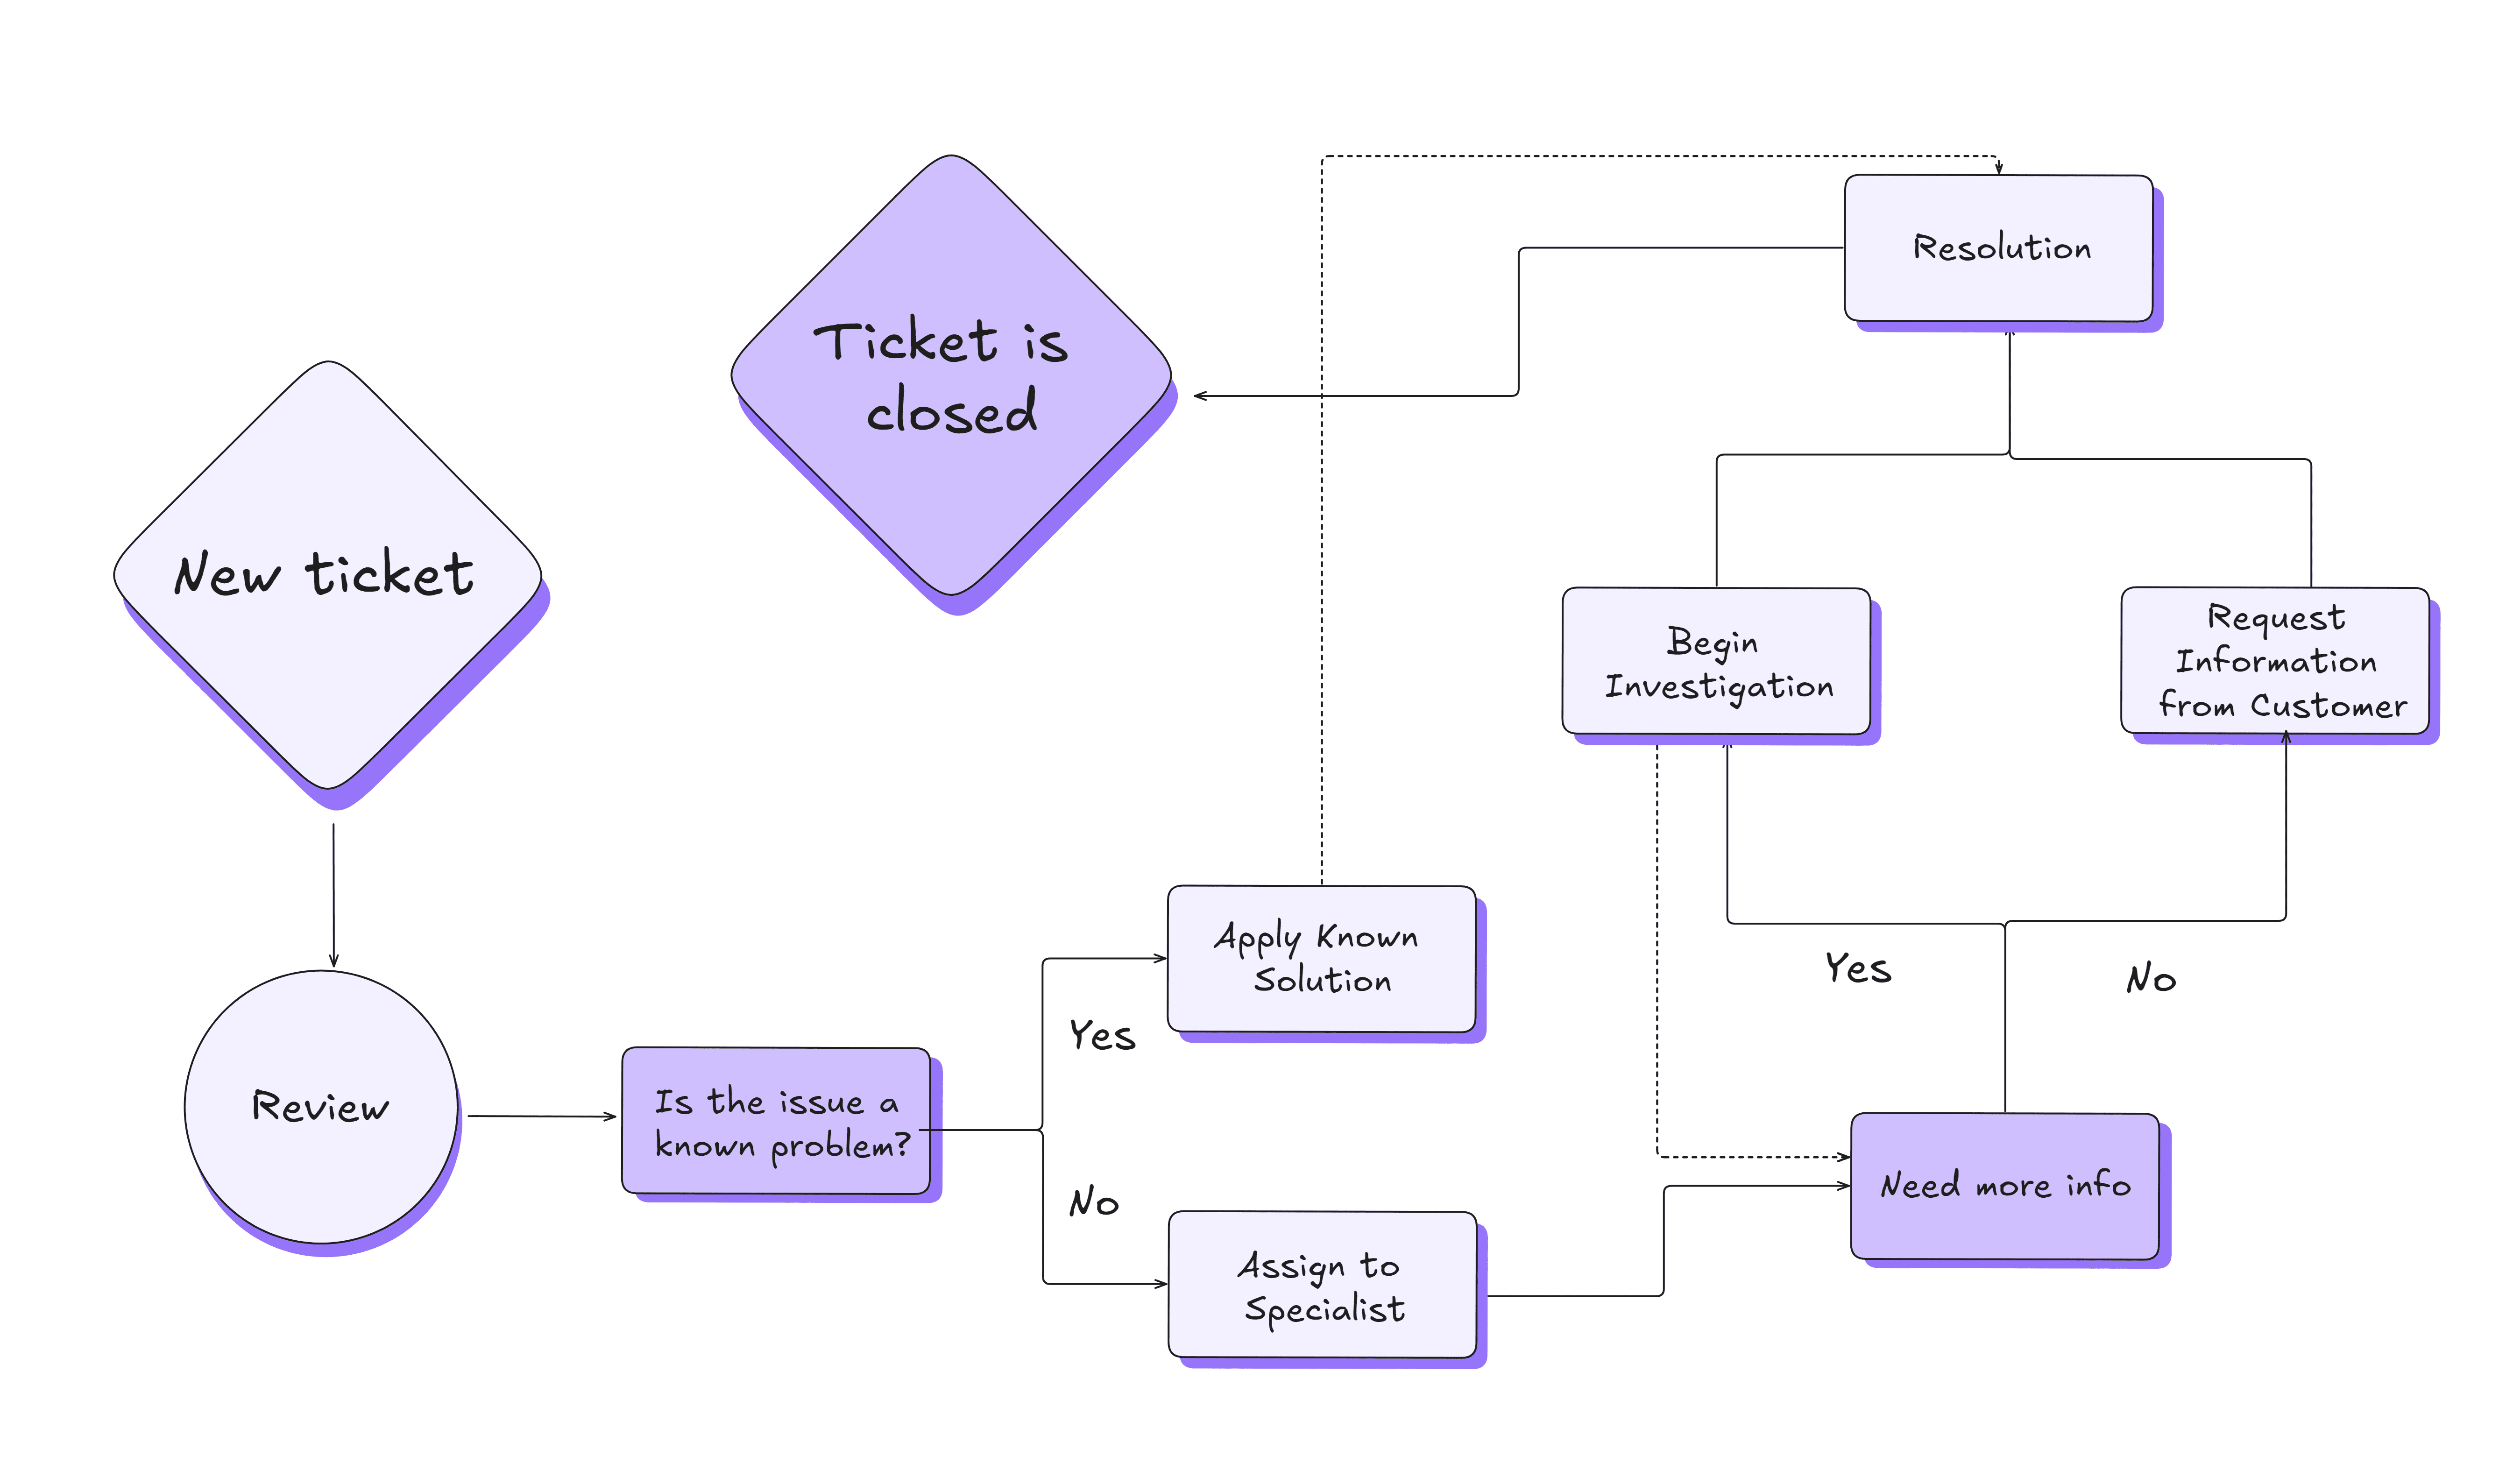
Create simple Flowcharts fast in Excalidraw with keyboard shortcuts and an easy-to-use, free, online whiteboard.

Use frames and visuals to show your ideas in your audience in an interactive way.

A skeletal outline of a digial interface, focusing on content placement and functionality.

Each type of UML diagram offers a unique perspective and is best suited to specific stages of the system design and development process, helping to visualize and communicate different aspects of a system effectively.