Sequence diagram
System interactions made clear
Map workflows, catch bugs, and make communication easier. Bring clarity to complex processes by visualizing the order, logic, and interactions within systems.
.png)
What is a sequence diagram?
A sequence diagram is a type of UML (Unified Modeling Language) diagram that illustrates how, when, and in what order the user and objects interact within a system, and how the system responds. Put simply, it shows a sequence of interactions between the user, system, and its elements needed to complete a task.
Sequence diagrams give software developers, UX designers, and non-technical stakeholders a clear view into how systems work. They make it easier to spot problems, design new architectures, and document existing processes, all in a simple, visual format that everyone can follow.
Sequence diagram symbols
Sequence diagrams use a standardized set of symbols to represent components of a system, entities that interact with it, and tasks performed in the process.
.png)
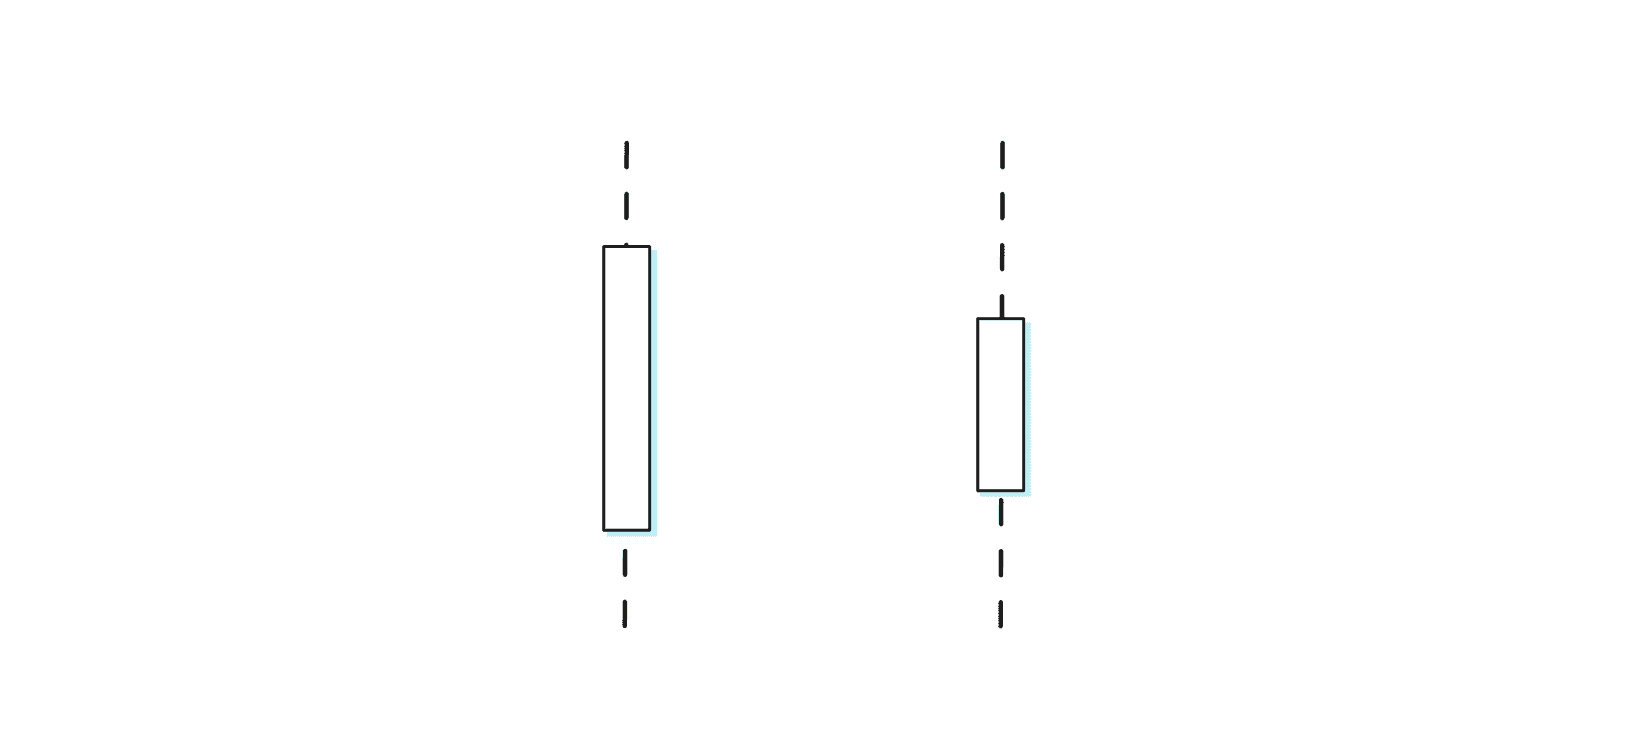
Lifelines and actors
Sometimes referred to as an object, a lifeline (labeled rectangle with downward line) is a participant of an interaction, like a shopping cart or payment gateway.
Though the line is usually dashed, in some frameworks (like Mermaid), it can be solid. Both are fine, as long as you're consistent.
An actor (stickman figure) is an external entity that interacts with the system. Usually, this is the user, e.g., a customer starting the process by placing an order.
Activation boxes
Also known as activation, the thin rectangle placed on the vertical lines indicates that the object is involved in the operation initiated by a message. The longer the task takes, the longer the activation box.
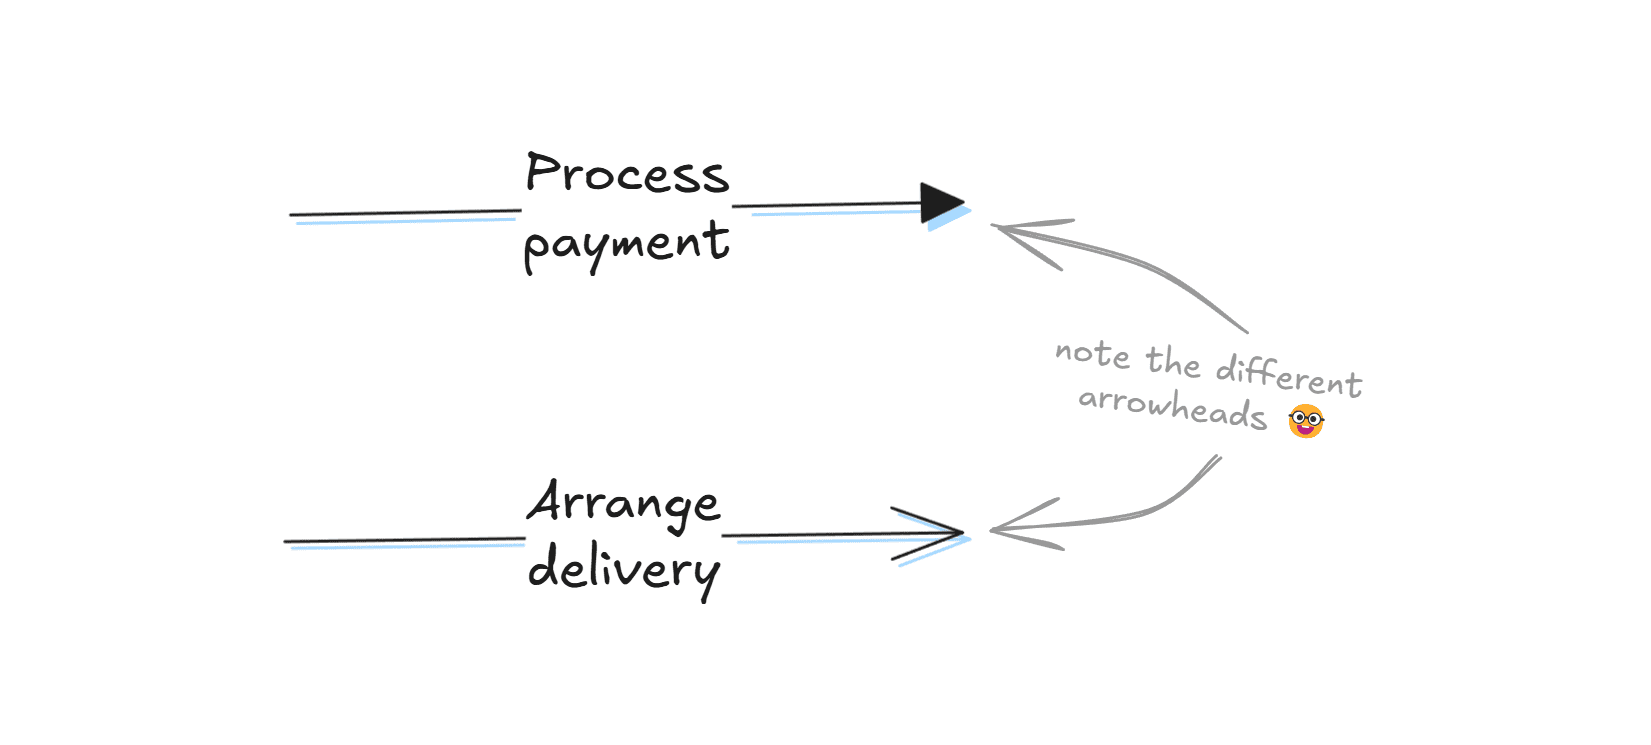
Synchronous and asynchronous messages
Messages are signals, operations, and information exchanged between objects.
Arrows with a solid arrowhead represent synchronous messages. When an object sends a synchronous message, it must wait for a response before the interaction can continue.
In the case of an asynchronous message (marked with a lined arrowhead), the interaction can continue without waiting for a response from the receiver.
.png)
Return and self messages
A return message (dashed arrow with a lined arrowhead) is sent when the receiver finishes processing a message and returns control to the caller.
A self message (a U-shaped arrow) is a message that an object sends to itself. It usually represents an internal operation.
.png)
Create and destroy messages
A create message adds a new object to the sequence diagram. It is attached to the lifeline it creates.
A destroy message does the opposite, removing an existing object. It's marked with an X attached to the destroyed lifeline.
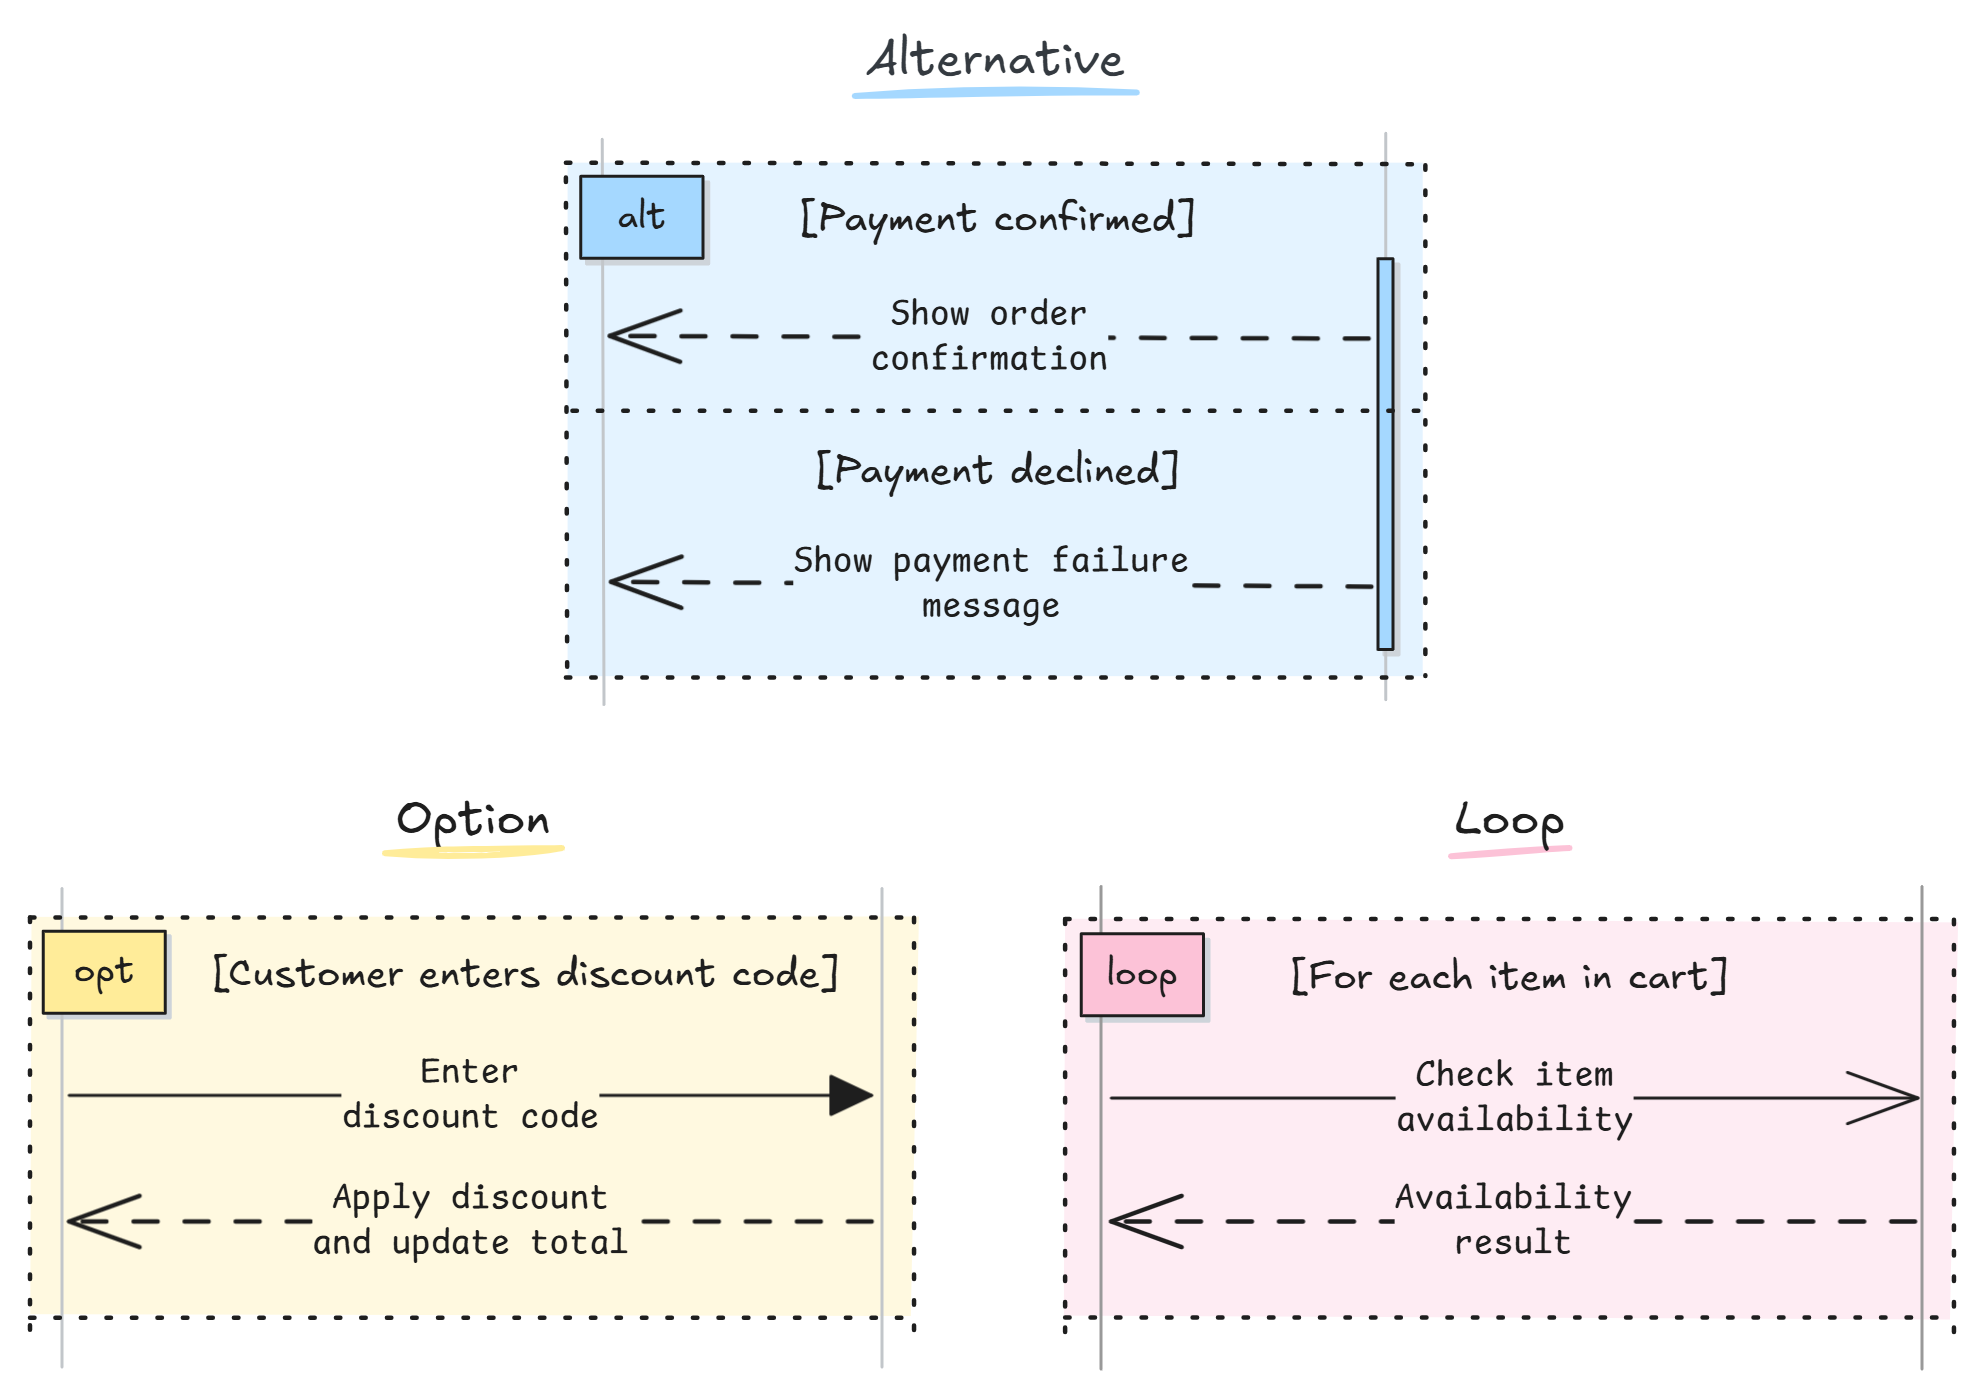
Alternatives, options, and loops
An alternative (alt) frame shows possible flows of interaction, where only one is executed if a condition is met.
An option (opt) represents a single path that executes only if its condition is true.
A loop is a sequence of messages repeated until a condition is met.
All three elements include text in brackets for additional context, like the condition required or the action that triggers the process.
How can sequence diagrams help specific professions?
Software Developers
Map the logic of interactions between microservices, user interface, databases, and other components. Visualize error handling scenarios.
Business Analysts
Illustrate how orders move through the system to identify possible improvements. Specify intended behavior for features like automated invoice generation.
Project Managers
Use sequence diagrams to explain system behavior to clients, executives, and non-technical team members. See dependencies between interactions to plan tasks ahead and avoid blockers.
UX/UI Designers
Find friction points in processes like online checkout or account registration. Reveal where users might abandon the process, e.g., during payment or address confirmation.
Tips and tricks for creating sequence diagrams
Best practices
- Reduce return messages: A synchronous message already implies a return, so return messages are often optional unless you need a high level of detail. You can also include the return value in the original message.
- Use conditional elements: Alternatives, loops, and options will help you model complex interactions in a structured way.
- Focus on a single use case: If a process is very complicated, it’s often clearer to split it into several sequence diagrams instead of trying to cover all scenarios in a single overloaded one.
Creating sequence diagrams in Excalidraw
- Edit lines and arrows: In the left-hand menu, you can adjust line style and arrowhead shape to distinguish between types of messages.
- Click less with shortcuts: Press R or 2 to draw a rectangle, A or 5 to draw an arrow, and L or 6 to draw a line.
- Place elements accurately: Right-click on the whiteboard and select "Snap to objects" or "Toggle grid" to arrange sequence diagram elements evenly.
- Add color for clarity: Use colors to highlight different elements of the diagram like objects and alternatives.
- Use libraries and templates: Browse Excalidraw libraries or open a new scene with editable sequence diagram components to create diagrams with ease. Note: The scene opens in the free editor. You'll be able to save or export your current work before loading the scene.
How to draw sequence diagrams faster in Excalidraw
With AI
- Click "More tools" in the toolbar and then "Text to diagram".
- Be specific; define the type of diagram, its purpose, and details like the specific symbols you want to use.
- You can view your AI-generated sequence diagram as Mermaid code.
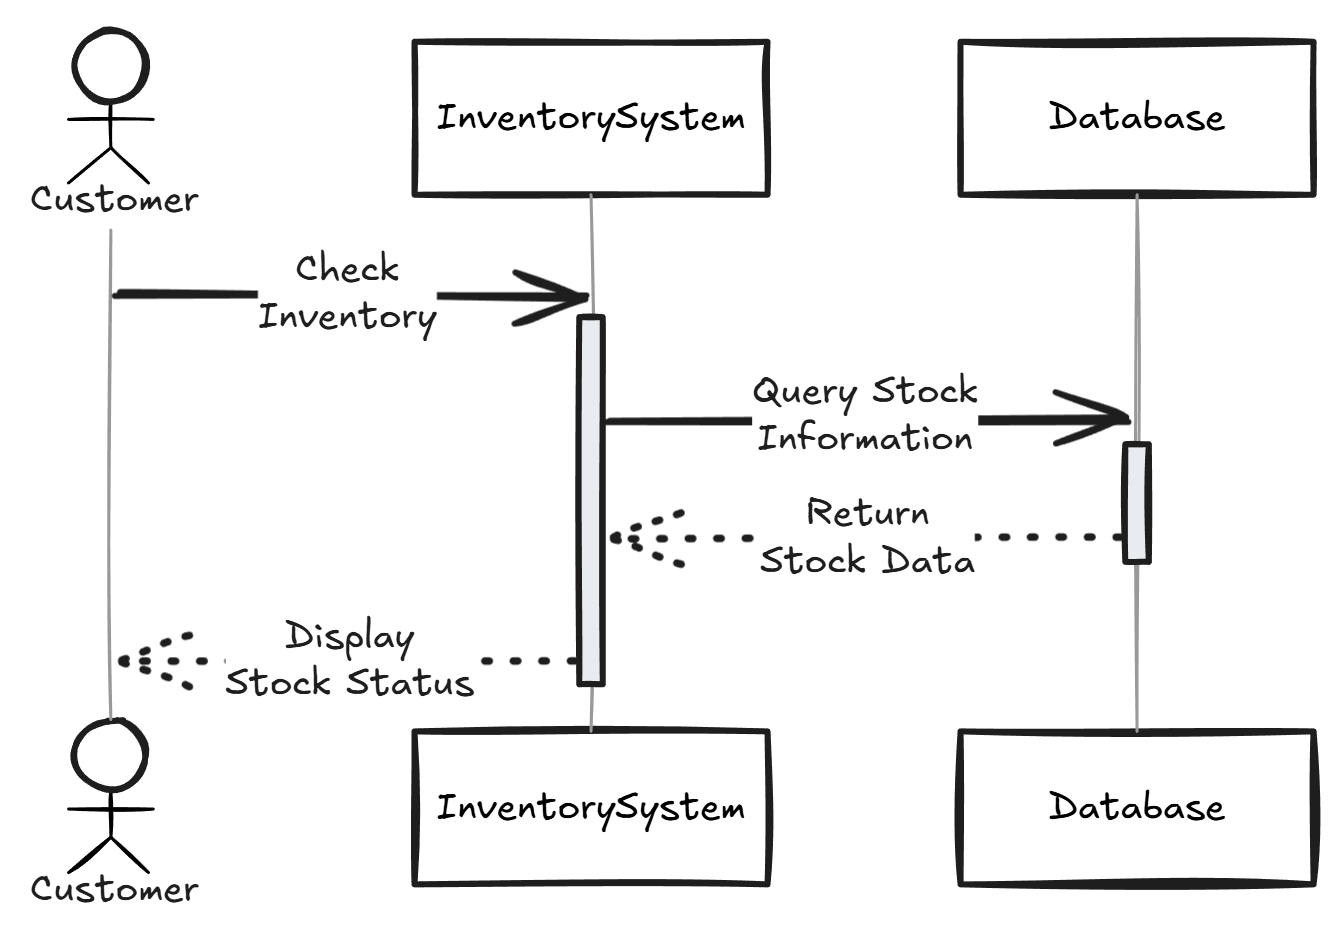
- Here's an example of a prompt and a diagram generated: "Generate a sequence diagram for checking inventory. Use activations and the actor symbol for the customer."
With Mermaid code
Mermaid is slower than AI prompts, but more consistent and compatible with GitHub, GitLab, Notion, Markdown, and other tools.
- Click "More tools" in the toolbar and then "Mermaid to Excalidraw".
- Be specific; state the type of diagram and its purpose.
- Type in Mermaid code to generate the diagram. If you need help writing the code, click the link in the hint above the code box to open the Mermaid tutorial on sequence diagram syntax.
- Check out this sequence diagram for the login process, generated in Excalidraw with the following Mermaid code:
1sequenceDiagram2 actor User3 participant UI as Login Page4 participant Auth as Authentication System56 User->>UI: Enter username & password7 activate UI8 UI->>Auth: Verify credentials9 activate Auth10 Auth-->>UI: Success / Failure11 deactivate Auth12 UI->>User: Grant access / Show error13 deactivate UI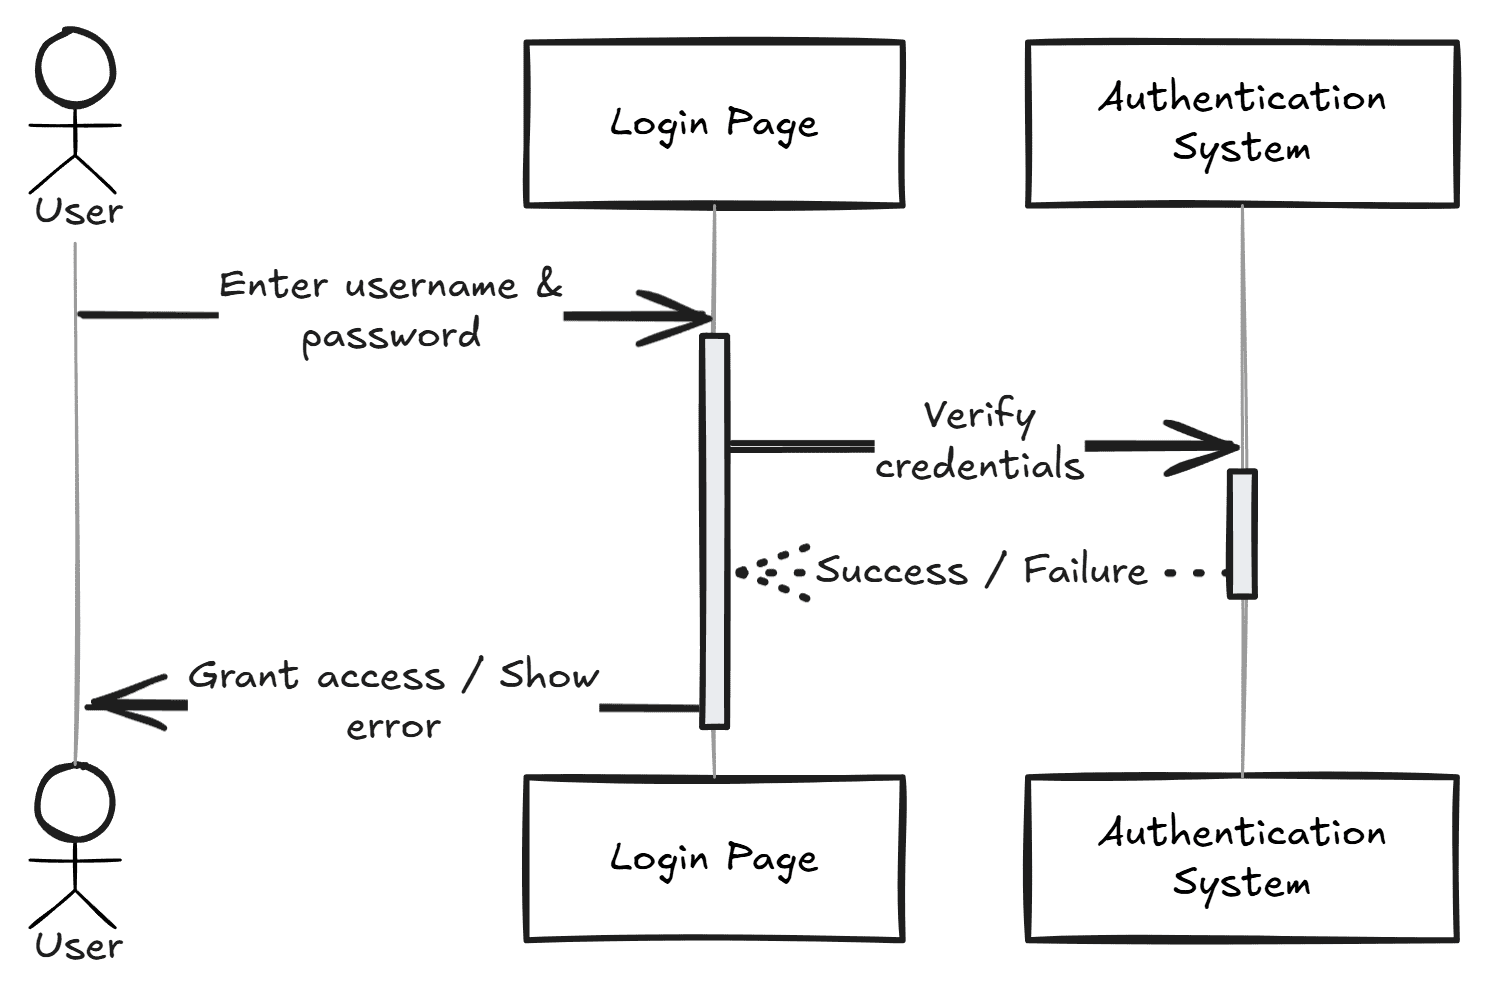

Wrapping up
Sequence diagrams visualize how parts of a system interact over time, giving both technical and non-technical stakeholders a clear overview of the process. They illustrate the order of operations, highlight potential issues, and clarify requirements.
Software development and design is where sequence diagrams are particularly useful. Use them to map customer journeys like online checkout, model backend processes such as payment, and show how multiple systems interact in workflows like customer support.
Business use or teamwork? Try PLUS features
💡 More AI iterations: Draft sequence diagrams freely using prompts with more requests available.
🎙️ Voice hangouts and screenshare: Collaborate on your sequence diagrams in real time without switching to other tools.
💬 Comments: Provide additional context for your sequence diagrams and highlight important details.
📺 Presentations: Instantly turn your sequence diagrams into polished presentations for team and client discussions.
📂 Work organization: Manage and categorize sequence diagrams for different use cases with Collections.