Data flow diagram
A guide to data process visualization
Map complex data architectures onto clear diagrams. Help everyone understand how information moves through a system.
What is a data flow diagram?
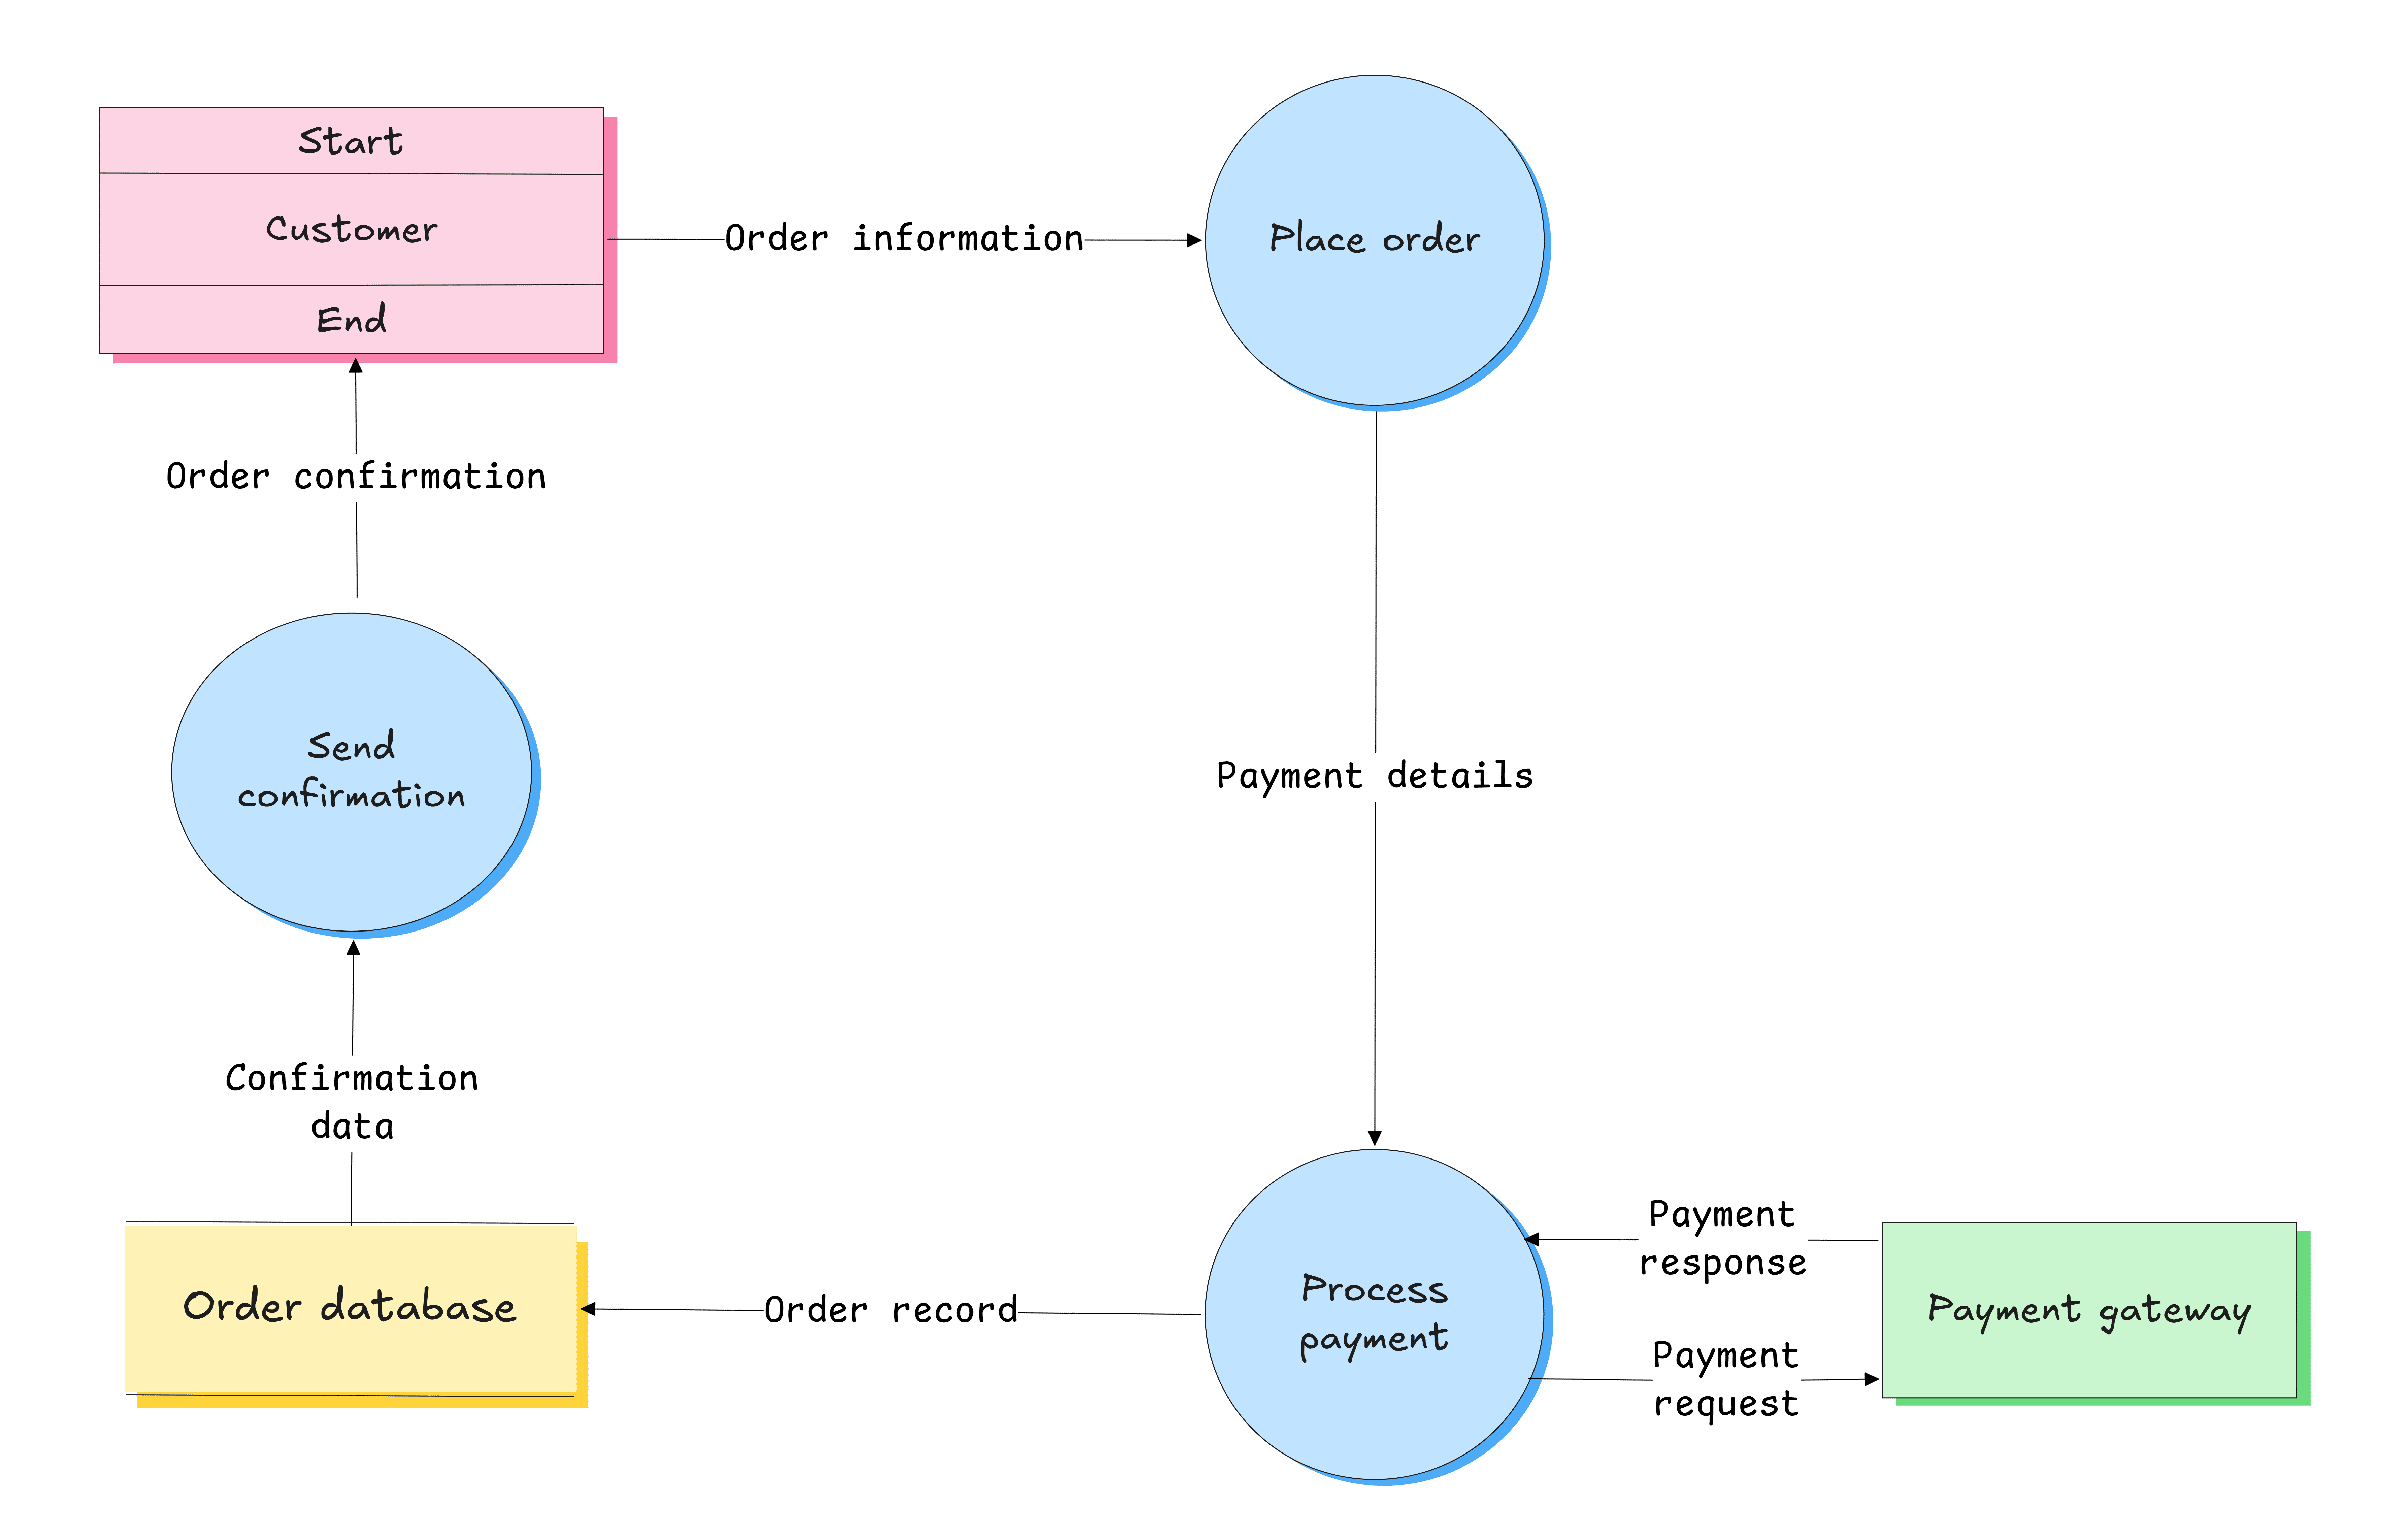
A data flow diagram (DFD) is a visual representation of how data moves within a system or a process.
DFDs make data architecture easier and faster to understand. They help software engineers, business analysts, system architects, and other professionals design data structures, find problems, and collaborate.
Data flow diagrams use graphical symbols like arrows, circles, and rectangles to illustrate the movement of data, processes, inputs, outputs, data stores, and other components. For consistency, these symbols are standardized and grouped into notations.
.png)
Data flow diagram vs flowchart
Data flow diagrams focus on the movement, storage, and transformation of data between stages and components within a system.
Flowcharts show a sequence of steps needed to achieve a specific result. Instead of data flows, they visualize decision points, actions, and dependencies.
Learn more about flowcharts in our dedicated use case.
.png)
Types of data flow diagrams
While all DFDs represent data movements, they can vary in technical complexity and level of detail to serve different purposes and team members.
.png)
Logical data flow diagram
This type focuses on the business side of the system: what its objective is and what actions are required to achieve it. A logical DFD maps steps and the data involved, without technical or implementation details.
When to use it
A logical data flow diagram helps understand the business requirements of the process before it's implemented. It's useful for working with non-technical users.
.png)
Physical data flow diagram
A physical data flow diagram focuses on the technical aspects of a system or process and how it will work. It may cover the hardware, software, and people involved.
When to use it
A physical DFD is a blueprint for developers who will handle the technical setup. It follows the business requirements outlined in a logical data flow diagram.
How can data flow diagrams help specific professions?
Data Analysts
Map customer data flows between the website, CRM, and a data warehouse. Find inefficiencies and inconsistencies, e.g., two departments collecting the same data separately.
Software Developers
Identify data entry and exit points to see where API endpoints are necessary. Use DFDs for troubleshooting by finding steps that may disrupt the data flow.
Business Analysts
Communicate business requirements for an onboarding process to the product team. Highlight flows where data requires additional checks, e.g., for HIPAA or GDPR compliance.
Project Managers
Include DFDs in technical documentation to help teams and clients understand the flow of data. Visualize the requirements for user registration or payment processing to plan and assign tasks efficiently.
Tips and tricks for creating data flow diagrams
Best practices
- Stay consistent: Use a standardized set of symbols across all your DFDs to avoid confusion. The two most commonly used sets are the Yourdon and Coad notation and the Gane and Sarson notation.
- Ensure valid data flows: All processes and data stores should have at least one input and output. Data should move through a process before entering or leaving a data store.
- Label components: Add short labels where necessary to describe data and storage type, transformations, entities, and other components.
- Make DFDs readable: Don’t cross data flows, avoid long labels, and use unique names for every process.
Creating DFDs in Excalidraw
- Draw faster with AI: Write a prompt or use Mermaid code to draft a data flow diagram in seconds and tweak it on your Excalidraw whiteboard.
- Collaborate: Share your whiteboard with others to work on your diagrams together in real-time.
- Organize elements: Select components and use the align feature in the left-hand menu to even them out. Right-click on the board and toggle the grid and snapping to easily arrange objects in your DFD. Hold Cmd/Ctrl when moving objects to toggle snapping on and off.
- Customize arrows: Use the left-hand menu to change arrow type and arrowhead. Hold Ctrl/Command when drawing an arrow to prevent it from automatically snapping to elements.
- Use libraries: Check out the dedicated Excalidraw libraries or open a new scene with editable data flow diagram components to build consistent and clear DFDs from ready-made elements. Note: The scene opens in the free editor. You'll be able to save or export your current work before loading the scene.
Useful shortcuts
- R or 2 to create a rectangle. O or 4 to create an ellipse.
- Enter to type text and Esc when finished.
- Cmd/Ctrl+Arrow key to duplicate the selected element and connect it with an arrow.
- Tab to quickly change the shape of the selected element.
- Opt/Alt+Arrow to move between elements.
- Shift+1 to zoom to fit all elements.
- ? to explore all shortcuts.

Wrapping up
Data flow diagrams visualize how data moves through a system, showing processes, data stores, and external entities. They present complex systems more simply, improving communication between business users, product teams, and clients.
For developers, data flow diagrams are a clear representation of the data structure. Through that, DFDs support system design, implementation, analysis, and troubleshooting.
Business use or teamwork? Try PLUS features
🎙️ Voice hangouts and screenshare: Discuss your data flow diagrams in real-time. No need for additional tools.
💬 Comments: Give and receive feedback directly on your DFD for easy improvements and revisions.
💡 Extended AI: Use prompts to create and tweak your diagrams freely with more iterations available.
📺 Presentations: Quickly convert your data flow diagrams into presentations for team meetings or client reviews.
📂 Work organization: Group and manage diagrams for various systems using Collections.